Peter Smith

Microsoft (MSFT) recent price action shows a solid return of buying pressure. After working through a correction, MSFT bounced sharply from a well-defined support zone, signaling that investor confidence is back and the uptrend remains intact.
Blue Box Reversal Confirms Market Strength
The 4-hour chart shows a clean three-wave pullback that ended between $487 and $497, according to analysts at Elliottwave Forecast. This zone lined up with the 1.236 Fibonacci extension, creating strong technical support where selling pressure faded. A "Turning Up" signal appeared near $492, marking where momentum shifted back to the bulls.
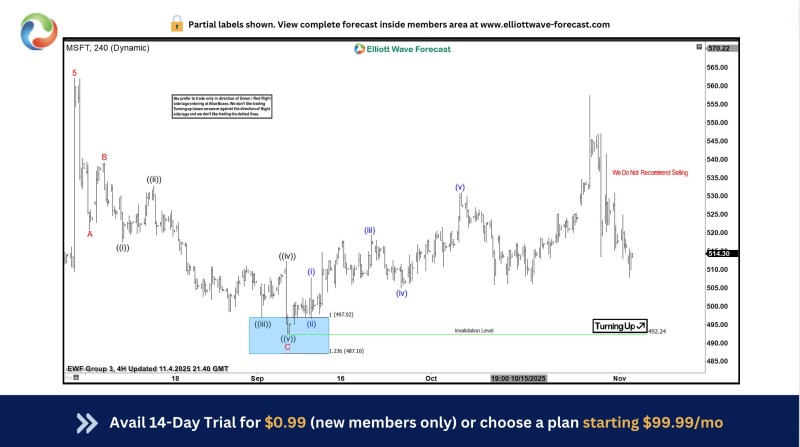
Since then, Microsoft has pushed back above $510, confirming the bullish setup. The current pattern shows a complete five-wave advance, indicating continuation rather than another deeper drop. The chart notes "We Do Not Recommend Selling," reinforcing that the bigger trend still points higher.
Elliott Wave Analysis and Fundamental Drivers
This rebound looks like part of a larger bullish pattern driving Microsoft's long-term move. The correction appears complete, with the low hitting projected support almost perfectly. The final leg down bottomed right where expected, a new set of impulse waves has begun, and pullbacks are now attracting buyers rather than triggering sell-offs.
Beyond the charts, Microsoft's fundamentals support the bullish structure. The company's AI integration through Azure and Office, powered by OpenAI technology, continues driving growth expectations. Strong cloud demand and solid quarterly results keep institutional investors engaged, making Microsoft one of the sector's top performers.
 Peter Smith