 Eseandre Mordi

Microsoft (MSFT) long-term uptrend shows no sign of slowing down. The latest Elliott Wave analysis suggests MSFT has confirmed a bullish continuation after bouncing sharply from a key support zone. As the stock pushes beyond $500, analysts remain aligned with the "Right Side Up" outlook, signaling positive market momentum.
Strong Reversal From the Blue Box Support Zone
According to trader Elliottwave Forecast, the weekly chart shows a textbook corrective structure where Microsoft completed an (A)-(B)-(C) correction and reversed higher from the blue box area between $355 and $293. This high-probability buy zone triggered a decisive move upward, confirming the continuation of the bullish sequence.
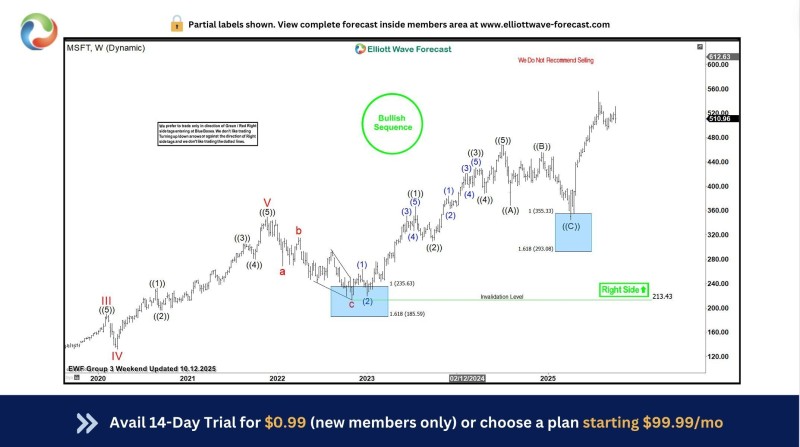
The chart shows a Right Side Up label with a "We Do Not Recommend Selling" note, reinforcing the bullish stance. The rebound from the blue box area suggests a strong resumption of impulse waves after a completed corrective phase.
Wave Count Aligns With Sustained Uptrend
Microsoft remains within an extended impulsive advance. Key observations include:
- The structure shows a completed wave (2) bottoming near $235, followed by a powerful upward cycle moving toward wave ((5)).
- The ((C)) correction ended above the invalidation level at $213.43, confirming the long-term bullish structure stays valid.
- The 1.618 Fibonacci projection at $293.08 acted as a strong technical pivot.
- Multiple completed five-wave substructures indicate sustained bullish control.
- The projected upper resistance near $610–$620 aligns with the next major wave completion target.
Fundamental Strength Reinforces Technical Setup
The bullish technical pattern coincides with Microsoft's strong business momentum across AI, Azure cloud, and enterprise software. The company's AI copilot integration has accelerated revenue expectations and improved tech sector sentiment. This alignment between fundamentals and chart structure strengthens the probability that MSFT will maintain its trajectory into 2026.
 Eseandre Mordi


