 Artem Voloskovets

⬤ Microsoft's stock keeps dropping after completing a double-top pattern that traders have been watching closely. The shares broke below a major support zone and are now approaching the 100-day moving average around 471.
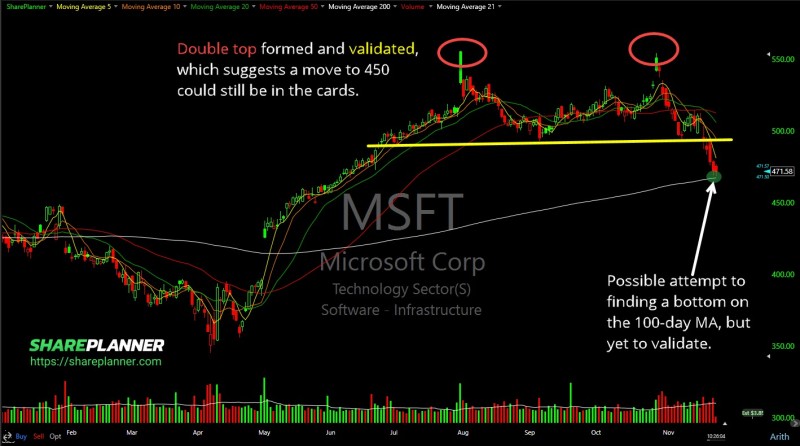
⬤ The chart shows two clear peaks that formed the double top, followed by a breakdown below the mid-490 support area. Once that level gave way, MSFT accelerated downward with noticeably higher selling volume. While the stock seems to be trying to find its footing near the 100-day moving average, there's no confirmation yet that it's actually stabilizing.
⬤ The uptrend that held strong for most of the year has now shifted. The stock is making lower highs and losing important technical support levels. If this pattern plays out like similar setups in the past, MSFT could move down to around 450 in the coming weeks.
⬤ This matters because Microsoft is one of the biggest names in tech and carries significant weight in major stock indexes. If MSFT continues falling, it could drag down sentiment across the entire technology sector and impact momentum in large-cap tech stocks. How the stock behaves around that 100-day moving average will tell us whether this is just a temporary pullback or the start of something deeper.
 Artem Voloskovets


