 Saad Ullah

⬤ Microsoft caught fresh buying momentum last week when the stock dipped into a significant support region on the weekly timeframe. MSFT drew buyers as it approached the $450-$472 zone, an area that's acted as a key reaction point during previous market cycles in 2021, 2024, and 2025. This price level helps define the stock's broader long-term trend structure.
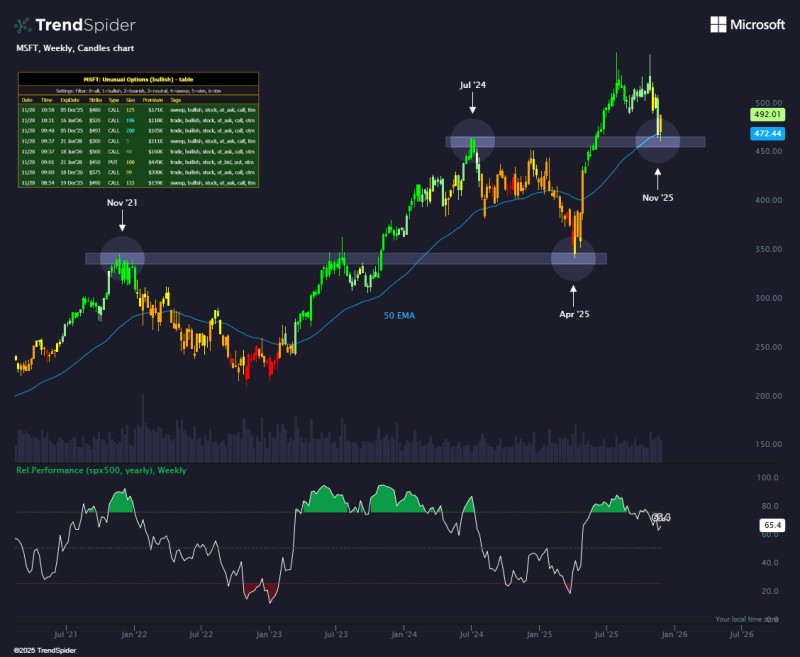
⬤ The decline brought MSFT back toward its 50 EMA, which has worked as dynamic support through multiple phases of the uptrend. The weekly chart shows Microsoft has regularly bounced after touching this moving average, and the latest candle follows a similar stabilization pattern. This technical setup suggests the stock might be working through consolidation after pulling back from its mid-year highs, with buyers defending previously established support zones.
⬤ The chart also captured unusual bullish options activity, showing several large call trades across different expirations. The premiums, contract sizes, and strike levels point to increased interest from options traders during the pullback. The relative performance indicator shows MSFT at 65.4 against the S&P 500 on a yearly basis, reflecting ongoing shifts in the stock's comparative strength over recent years.
⬤ This matters because MSFT remains one of the most influential stocks in major U.S. indices and a critical benchmark for the broader tech sector. Fresh buying near historical support could shape near-term sentiment across large-cap technology names and impact expectations for the wider market. The weekly chart's stabilization offers a reference point for tracking whether Microsoft holds this momentum or continues testing current support levels.
 Saad Ullah


