 Peter Smith

⬤ Microsoft shares took a hit after the latest earnings release, with the stock now trading below its 100-week moving average—a key technical level that traders watch to gauge long-term trend health. After peaking around $520 in mid-2025, MSFT has slid into the low $430s, showing clear signs that momentum has shifted.
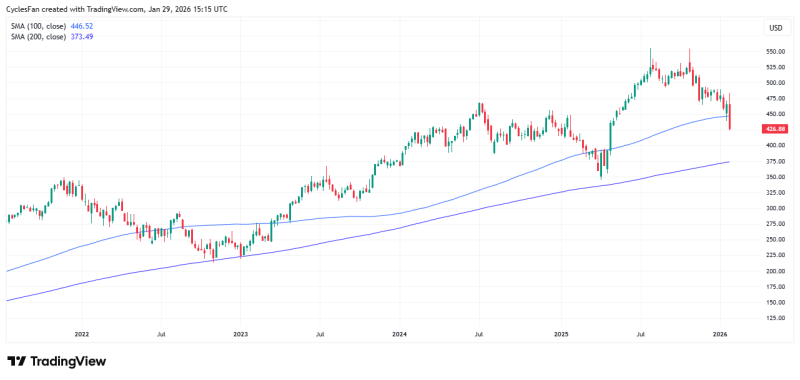
⬤ Breaking below the 100-week average suggests Microsoft may have topped out in late July. The stock typically finds support at this level during corrections before pushing higher again, but this time selling pressure hasn't let up. The drop from above $520 to the low $430s reflects a broader cooling off after a strong multi-year run.
The 200-week moving average near $370 represents the next major support level if downside pressure continues.
⬤ With the 100-week average now in the rearview mirror, eyes are turning to the 200-week moving average sitting around $370—roughly 12% below current prices. This zone has historically acted as solid long-term support during deeper pullbacks. If MSFT heads that direction, it would confirm a more serious correction rather than just a minor pause.
⬤ Given Microsoft's massive weight in tech indexes, sustained weakness here matters beyond just the stock itself. A controlled move toward the $370 level would signal a recalibration after years of gains, but if selling accelerates, it could drag broader market sentiment down with it.
 Peter Smith


