 Marina Lyubimova

⬤ META is trying to stabilize around $628.75 as it tests a potential double bottom near its trailing 20x earnings zone. The stock is holding above the 0.618 retracement at $600.68, a level that's acted as support before. After pulling back from highs near $796, META is now trading in a dense volume zone between the mid-500s and mid-600s where significant buying and selling has taken place.
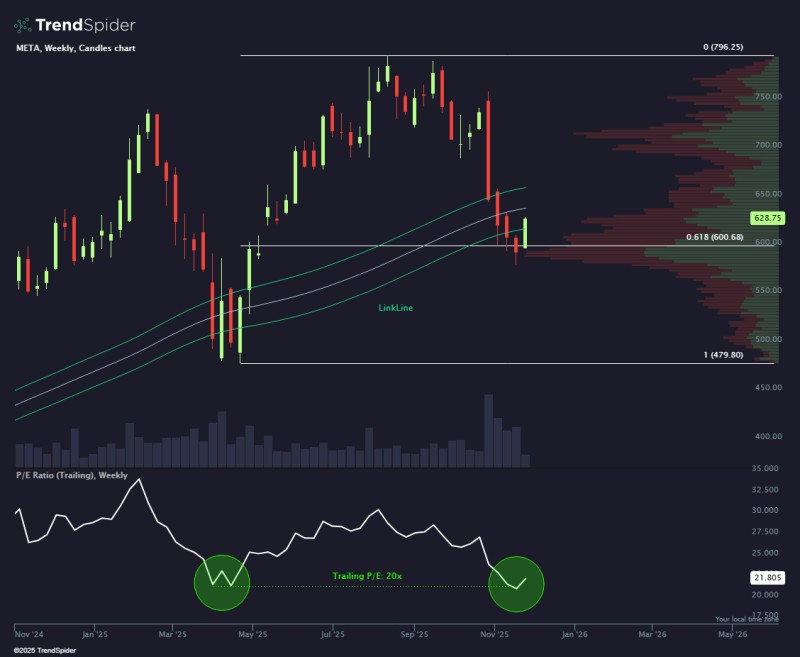
⬤ The weekly chart shows META sitting at the intersection of several technical supports, including long-term moving averages and a LinkLine support cluster. These overlapping areas have provided structural stability in the past. The current price action suggests the stock is trying to find its footing after recent weakness, with the latest weekly candle showing a modest bounce.
⬤ Looking at the valuation side, META's trailing P/E ratio is around 21.8, slightly above the 20x level it's tested twice this year. This creates a double-bottom structure at a historically important earnings multiple. The stock is essentially trading where price support and valuation support are lining up, which could be significant for what comes next.
⬤ The key question now is whether META can build on this stabilization or if it stays stuck in consolidation mode. The next few weekly candles should give us a clearer picture of whether the stock transitions into recovery or continues ranging within this broader structure.
 Marina Lyubimova


