 Eseandre Mordi

⬤ Meta Platforms (META) is catching attention as the stock pushes toward an important technical level on the 4-hour chart. META is being watched closely for a potential break above $605, which could unlock a move toward the $630 zone. Right now, the stock is trading at $601.68 while testing a persistent descending trendline that's been blocking upward moves throughout November.
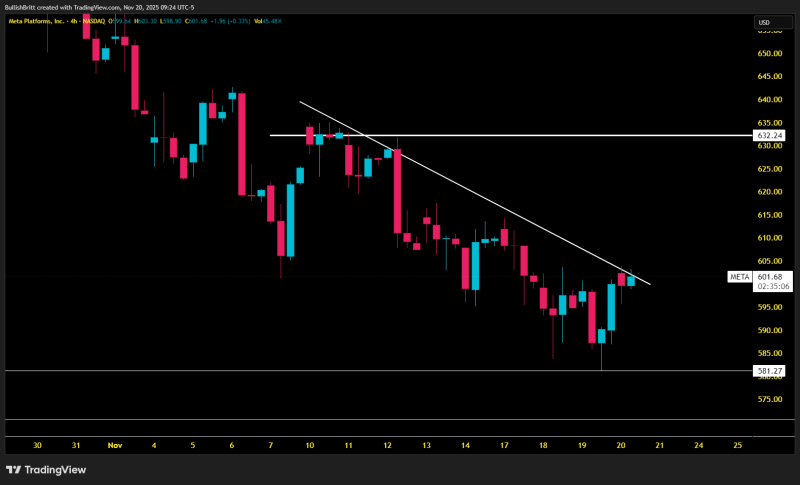
⬤ The chart shows a well-defined downward-sloping trendline starting from the early-month highs, with META getting rejected at this line multiple times. The $605 level stands out as a horizontal resistance zone that previously worked as support before giving way during the mid-month pullback. Recent action shows META bouncing off a local low near $581.27 and building higher lows, pushing the stock back into the trendline and resistance area. The candles show stronger bullish attempts, though resistance hasn't been broken yet.
⬤ The chart also marks an upside target around $630, which lines up with an earlier consolidation zone above the trendline. This level was a key pivot earlier in November, making it a logical target if META pushes through $605. Momentum has been gradually building as META holds above $595, but buyers still need a clean close above both the trendline and resistance to confirm the bullish move. Until that happens, META remains stuck in a tightening pattern with downward pressure overhead and support in the upper $580s.
⬤ This setup matters because META is sitting at a technical turning point that could shape short-term direction for one of the market's biggest tech names. A confirmed move above $605 could shift sentiment toward a broader recovery, while continued rejection at the trendline might extend the recent correction. How the stock reacts here could set the tone for large-cap tech as trading moves through the final weeks of November.
 Eseandre Mordi


