 Victoria Bazir

⬤ Meta Platforms (META) is under pressure as its price action unfolds in a textbook 5-wave decline from its October 29 peak. The stock is moving through a clear sequence of lower highs and lower lows, following the Elliott Wave structure that's keeping META on course toward the $577–$547 target range.
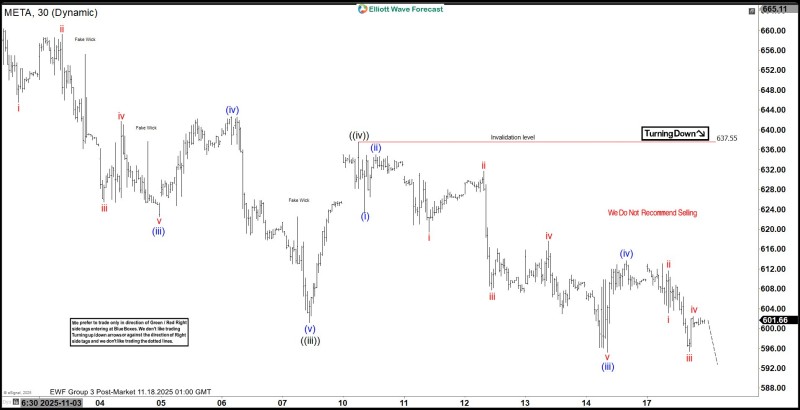
⬤ The technical picture shows multiple impulsive and corrective phases, with brief volatility spikes appearing as "fake wicks" within the broader decline. The key invalidation level sits at $637.55—and as long as META stays below that threshold, the bearish wave count remains in play. Right now, the stock is progressing through what looks like the final stages of this decline before hitting the projected support zone.
⬤ Here's the thing: while META is clearly trending lower, this isn't the time to pile into short positions. The focus is on watching the current pattern complete. That $577–$547 zone matters because it's where Elliott Wave symmetry and previous structural pivots converge—making it the most likely area for this wave to wrap up if the decline continues as mapped out.
⬤ What happens when META reaches this support region could shape the next chapter. If the stock sticks to its Elliott Wave playbook and momentum stays bearish, all eyes will be on how it behaves once it tests that zone. The reaction there will likely determine whether we're looking at a bottoming process or something deeper heading into year-end.
 Victoria Bazir


