 Usman Salis

⬤ META has crashed to its most oversold position in three years after a brutal selloff pushed its daily Relative Strength Index down to 23.32. The stock broke below its 200-day moving average and slid toward $590, marking the most extreme momentum collapse since late 2022 when shares were trading under $100. The combination of relentless selling and extreme oversold conditions represents one of META's sharpest technical breakdowns in recent memory.
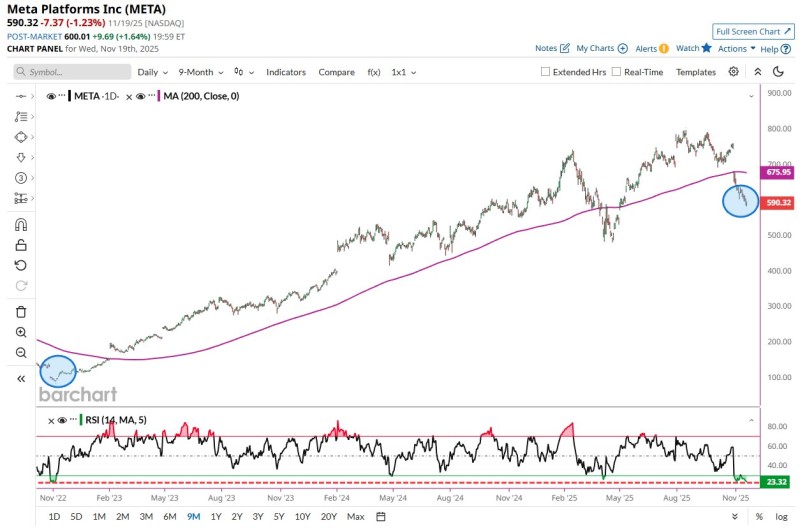
⬤ The breakdown through the 200-day moving average is especially notable since this trend line had supported META throughout its entire multi-year rally. The RSI crash into deep oversold territory near 23 matches conditions last seen three years ago, right before META bottomed and started a massive recovery run. With the stock now trading well below the moving average around $675, META is showing its weakest technical setup since early 2023.
⬤ The chart shows repeated momentum swings, but this latest RSI drop stands out as one of the most extreme readings in years. META has entered a volatile downtrend that's a stark contrast to the steady climb earlier this year. After-hours trading showed META bouncing slightly to around $600 from its $590.32 close, suggesting some stabilization, but selling pressure remains intense.
⬤ This matters because META is dealing with a rare combination of technical warning signs - a break of long-term support and an RSI reading that typically signals capitulation. These conditions could ripple through the broader tech sector, given Meta's massive market weight and its status as a bellwether for high-growth stocks. The oversold setup puts the stock at a potential turning point as volatility stays elevated.
 Usman Salis


