Artem Voloskovets

After getting hammered with a 10% drop from recent highs, Meta has finally caught a break.
What the Chart Shows
Technical analyst LuxAlgo points out that the stock is rebounding right off a critical support level around $639—a zone packed with buying activity. It looks like investors are treating this pullback as a buying opportunity, which could set the stage for a short-term recovery if momentum holds.
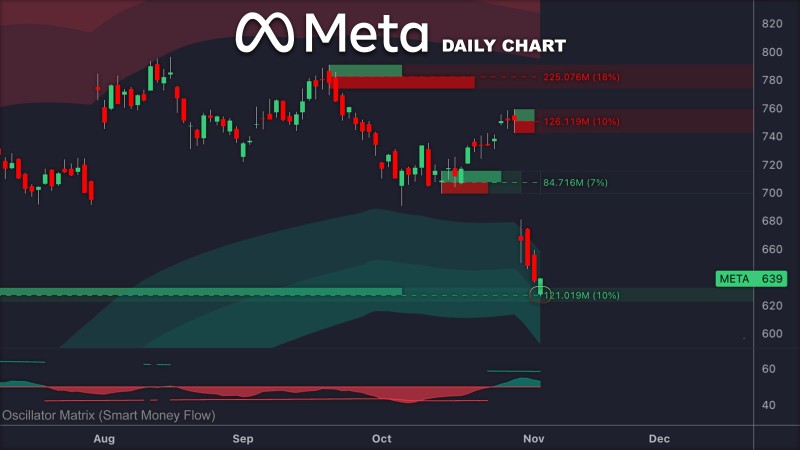
Meta's daily chart tells a clear story of support holding and buyers stepping in:
- $639 support zone — This is where the action is. A massive accumulation block (121M in volume, representing a 10% retracement) sits here, and the price bounced hard off it. The Smart Money Flow channel confirms large players are coming back in.
- $700–$710 resistance — First hurdle ahead, with a smaller supply area (84.7M / 7%). A clean break above this level would signal that buyers are gaining control.
- $750–$780 major resistance — The bigger test. This zone saw heavy selling before (126M–225M / 10–18%), so Meta will need strong momentum to push through.
The Smart Money Flow oscillator at the bottom of the chart has flipped from red to green—historically a good sign that institutional money is flowing back in.
Why the Bounce Makes Sense
Meta's rebound isn't happening in a vacuum. The stock pulled back into more attractive valuation territory, which brought long-term buyers off the sidelines. Meanwhile, Meta's core business—ad revenue, AI tools, and cost management—remains strong. Add in some stabilizing Treasury yields that are helping the broader tech sector, and you've got a setup that favors a recovery.
Meta found its footing at $639, and the buyers are back. With Smart Money Flow turning positive and clear resistance levels mapped out, the stock looks like it's entering a stabilization phase. If it can push above $700 and hold it, this recent dip might go down as a solid buying opportunity rather than the start of something worse.
 Artem Voloskovets