 Artem Voloskovets

Meta Platforms (NASDAQ: META) is facing a critical moment as it slides toward a support area that last triggered a strong rebound back in April 2025. After months of solid performance, the weekly chart now shows a potential gap-fill target near $620–$630—right around Meta's 50-week moving average, a level that often determines where the stock heads next.
The Technical Picture
As TrendSpider pointed out, "Gap fill in sight and valuation back near April lows. Let's see if buyers defend 20x earnings again." That pretty much sums it up: Meta is dealing with both a technical breakdown and a valuation reset, and they're both hitting at the same spot.
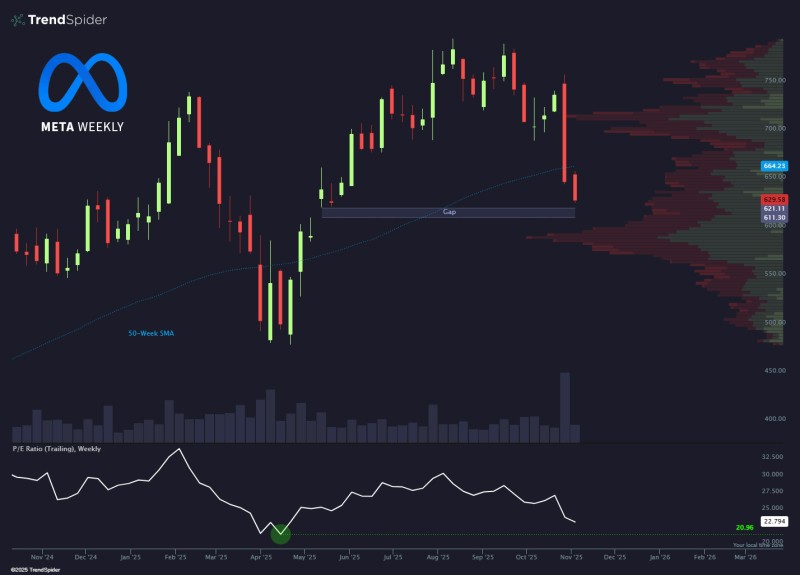
Meta's weekly chart shows a sharp drop from above $700, bringing it into a support zone that lines up with where it bounced in April:
- Gap fill zone sits between $620 and $630, just below the 50-week moving average around $664
- Valuation has dropped to roughly 22.8x earnings, approaching the 20x level that's historically attracted buyers
- Volume has picked up during the decline but hasn't reached panic levels yet
- Key support at $600—if that breaks, the next stop could be closer to $550
The stock broke below its 50-week moving average for the first time in months, signaling that momentum has shifted from bullish to neutral. The P/E chart at the bottom shows Meta trading near that 20x earnings threshold where value investors have stepped in before. The big question now: will they do it again?
Why the Pullback?
Meta's decline isn't happening in a vacuum. The broader tech sector has been pulling back as investors reassess valuations after a huge AI-driven run. Add in concerns about ad revenue, heavy AI infrastructure spending, regulatory pressure, and stubborn interest rates, and you've got a perfect recipe for profit-taking. For Meta specifically, this looks like a natural valuation reset—whether it becomes a higher low or something deeper remains to be seen.
If Meta can hold the $620–$630 zone and keep valuation near 20x earnings, buyers might step back in and set up a rebound. But if it breaks below $600, that would signal weakening institutional support and open the door to a deeper correction toward the low $500s. For long-term investors, this could be a buying opportunity. For traders, it's a wait-and-see moment—look for volume stabilization and weekly reversal signals before making a move.
 Artem Voloskovets


