 Saad Ullah

⬤ Meta Platforms is holding steady around $658 after forming another inside candle on the weekly timeframe—a classic sign that volatility is drying up and traders are waiting for the next catalyst. The stock has been stuck in this range after pulling back from the upper $700s, with price action now grinding sideways between clearly defined levels. The repeated inside candle pattern shows compression building as META sits below overhead resistance.
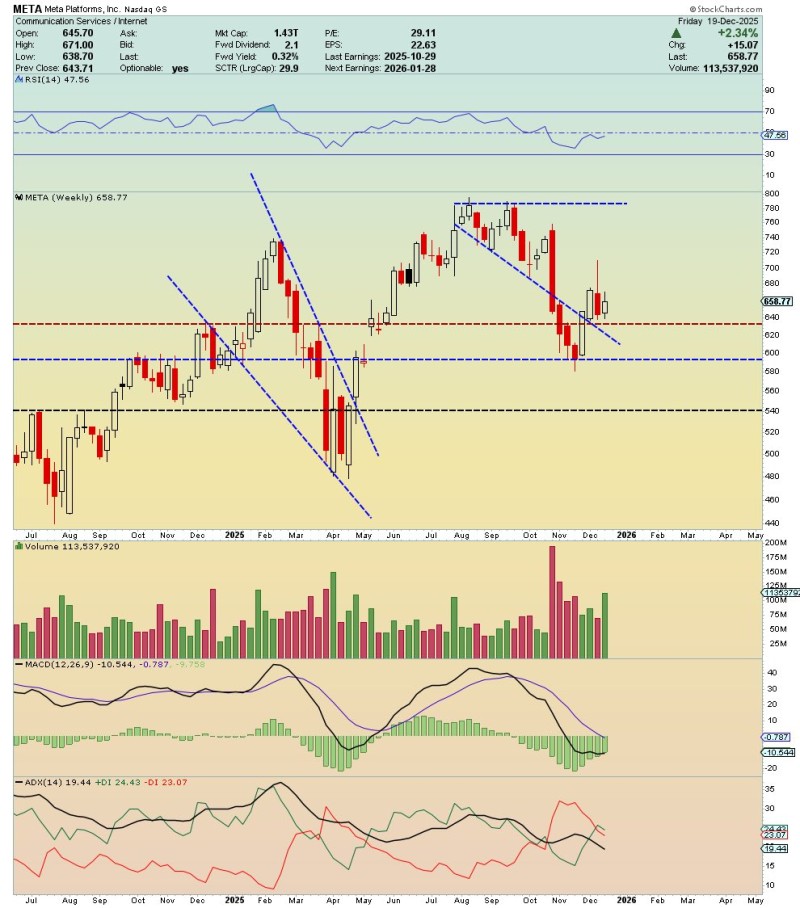
⬤ Earlier this year, META pushed aggressively toward the $780 zone before running out of steam. That rally was followed by a correction that dragged the stock down toward the $600–$620 area. This zone has proven solid as support, holding firm through multiple tests and keeping the floor intact. Since bouncing off that level, META has climbed modestly but keeps hitting a ceiling around $670–$690, locking the stock into a sideways grind.
⬤ The technicals are reflecting consolidation rather than any clear directional bias. RSI is sitting in the mid-40s to low-50s—right in neutral territory. MACD is still below zero but flattening out, showing that the bearish pressure from the earlier drop has faded significantly. Volume has also cooled off after spiking during the selloff, which is typical when a stock enters range-bound mode on the weekly chart.
 Saad Ullah


