 Saad Ullah

⬤ Meta Platforms caught traders' attention recently when the stock dipped into what technical analysts call a Blue Box zone and then bounced right back up. This wasn't just random price movement—it was a textbook Elliott Wave setup where the pullback hit a high-probability support area and buyers immediately stepped in. Instead of breaking down further, META did exactly what the wave count predicted: it rebounded cleanly.
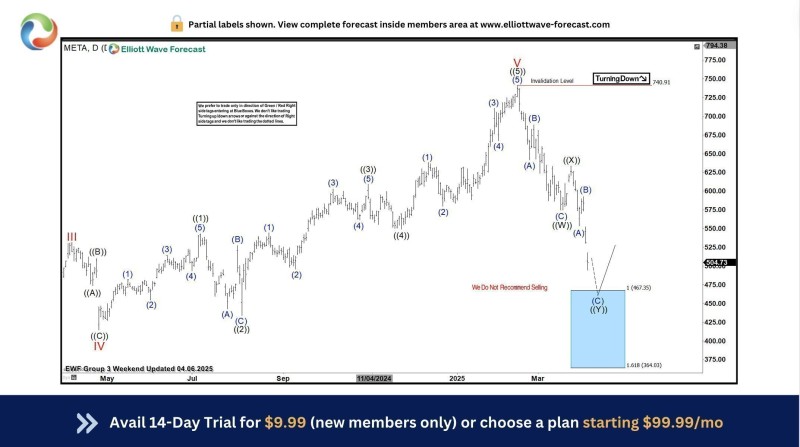
⬤ The daily chart shows how META came down into this Blue Box support region after completing a strong upward move. In Elliott Wave analysis, these zones mark areas where corrections typically run out of steam. Once the price reached that box, the selling dried up and the stock started climbing again. The whole sequence played out without breaking any critical levels, which confirms this was just a healthy correction within a bigger uptrend—not the beginning of something worse.
⬤ As one analyst noted, "The price dip reached a high probability buy zone, where buyers stepped in decisively, producing what was described as a picture perfect Elliott Wave reaction."
⬤ What's interesting here is how the chart layout tells the story. You can see META transitioning from its rally into a corrective phase, with that Blue Box acting as the key turning point. There's even a note on the chart warning against selling at current levels, which makes sense—the technical framework suggests the downside was limited and controlled from the start.
⬤ This matters beyond just META itself. When a massive tech stock like this respects structured technical levels during a pullback, it shows that wave analysis can still identify where price is likely to react, even if it can't predict every twist and turn. Since major tech names drive so much of the broader market these days, clean bounces like this one can shift sentiment quickly and help traders figure out where the real risks lie.
 Saad Ullah


