Peter Smith

⬤ Meta's stock is basically camping out in the same price zone right now, and the charts show something interesting happening. There's a ton of trading volume stacking up around these mid-$600 levels, which tells you this is where most of the action has been concentrated lately. The stock took a hit earlier, bounced back partway, and now it's just hanging around this range. What's catching attention is the deep volume profile sitting here, plus what looks like decent gamma exposure at the current price.
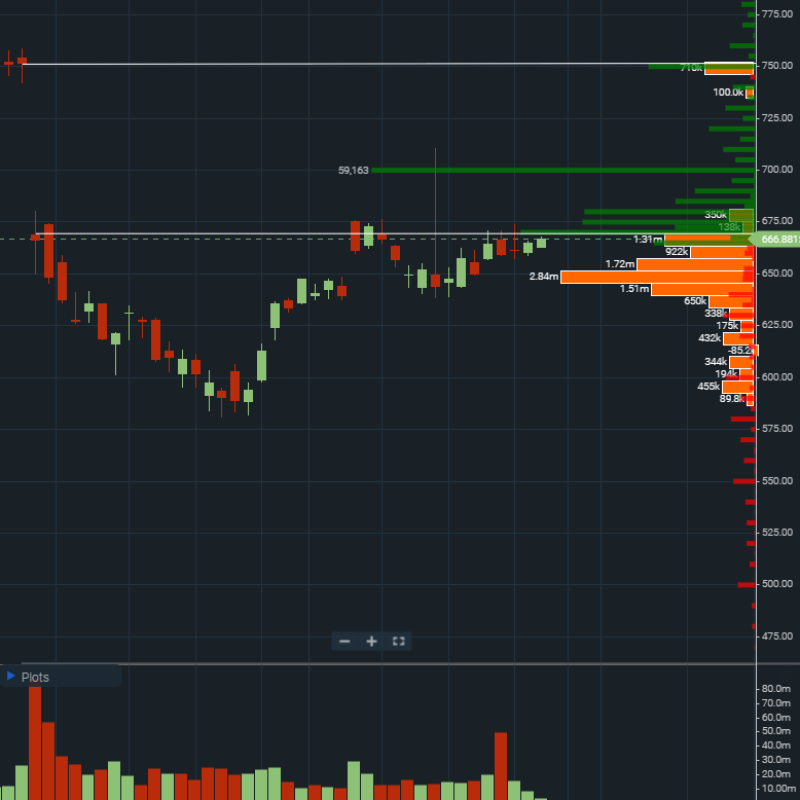
⬤ If you look at the volume profile, you'll see those big orange and green blocks clustered around the mid-$600s. That's not random—it means Meta has been trading at these prices long enough to create a solid foundation. Traders call this consolidation structure, and it's basically the stock deciding what to do next. Recent price action shows some modest upward movement, but nothing that screams breakout yet. The liquidity is still concentrated right where the stock is trading now.
⬤ The technical story here revolves around a potential move up to close that gap near $750. It's more of an educated guess than a guaranteed forecast, but the logic makes sense when you consider all that volume support sitting underneath the current price. That said, Meta is still trading below its previous highs, and it hasn't made any decisive push to break out of this range.
⬤ For a company as massive as Meta, watching it consolidate like this matters beyond just the stock itself. When a tech giant builds this much trading activity in one tight zone, it creates a reference point for how the broader market might react. If Meta does make a run toward that $750 level—or breaks down instead—it could shift momentum across the entire large-cap tech sector.
 Peter Smith