Alex Dudov

⬤ Meta Platforms has started bouncing back from a major support area that was flagged in recent technical analysis. The stock pushed higher after touching the Blue Box zone, where traders expected the corrective pattern to bottom out. This move has put long positions in what's being called risk-free territory, hinting that buyers might be taking back control after a sharp pullback.
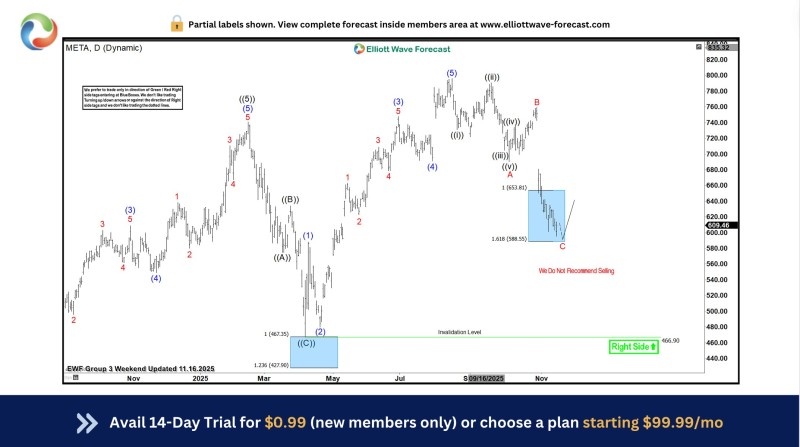
⬤ The chart shows META tested the Blue Box between roughly $588 and $653, a zone linked to the completion of a corrective C wave. The bounce from this level matches what the Elliott Wave structure predicted, suggesting the next leg up could already be forming. The setup stays valid as long as price holds above the key invalidation level, and the analysis notes this isn't an area to be selling.
⬤ The broader picture shows how META went through a drawn-out A-B-C correction after earlier five-wave rallies. The recent bounce signals the decline may have hit the exhaustion point marked by the forecast model. While there's no full confirmation yet of trend continuation, the upward reaction from support fits the technical scenario and backs up the importance of the Blue Box demand zone.
⬤ This matters because it could mark a turning point for one of the biggest tech stocks out there. A solid reaction from support might influence broader sector sentiment and shape expectations for near-term price action. The current structure leaves room for more upside as long as buyers stay in control above the key technical zone.
 Alex Dudov