 Saad Ullah

⬤ Meta Platforms (META) is showing a notable shift in structure on the 6-hour chart after slipping back inside its previous range. META initially pushed above resistance but failed to hold momentum, creating a deviation that's now turned into a bearish breakdown. This pattern mirrors what we've seen recently in other major tech stocks, where failed rallies have shifted into corrective phases.
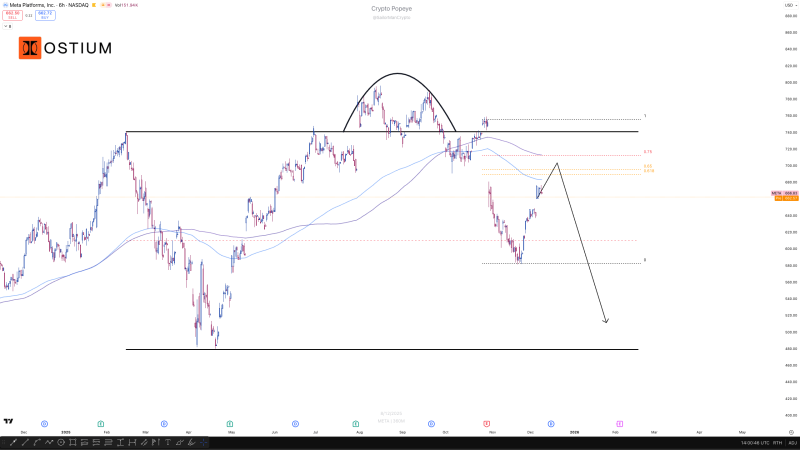
⬤ The chart shows META has pulled back sharply from its recent high and is heading lower while approaching key Fibonacci retracement levels. The mapped scenario suggests a possible short-term bounce toward the 0.618 or 0.75 Fibonacci zones before sellers take over again. The rounded top formation and failure to stay above moving averages on the 6-hour timeframe show bullish momentum is fading. The break in market structure means META is no longer holding the upward trend that drove its earlier strength this quarter.
⬤ The outlook points to a potential retest of resistance near the upper boundary of the range, where the previous deviation happened. This type of retest often acts as a decision zone, especially when it lines up with trend direction and Fibonacci confluence. Below current levels, the chart shows a substantial downside target near the lower boundary of the broader multi-month range. The shift from attempted continuation to deviation and then failure follows classic reversal behavior after extended rallies.
⬤ This matters because META plays a major role in shaping tech sector sentiment. A deeper drop from these levels could impact risk appetite across correlated equities, particularly among high-valuation growth stocks. How the stock reacts around the upcoming Fibonacci areas will determine whether META stabilizes or moves into a longer corrective phase.
 Saad Ullah


