 Usman Salis

⬤ IREN Limited has been trading sideways on the daily chart after hitting a wall just under $60 multiple times. The stock is hovering in the low-to-mid $50s range, with recent price action stalling below resistance but staying above the cloud support indicator. Sellers keep showing up near $60, but buyers aren't backing down either—they're defending the lower levels and preventing any real breakdown.
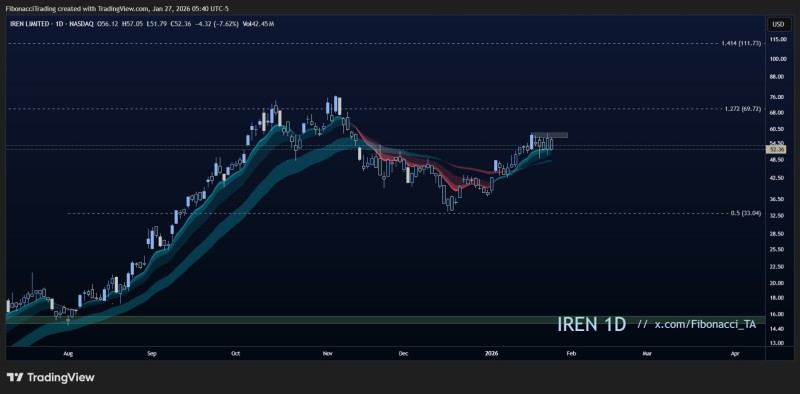
⬤ Looking at the bigger picture, IREN is in a recovery mode after pulling back in late 2025. The stock peaked near the high $60s at the upper Fibonacci extension zone before falling back and then stabilizing above the cloud. Now it's grinding higher again, but slowly. Recent candles are pretty tight, showing the market is basically stuck—neither bulls nor bears have taken control yet.
⬤ The $60 zone has become a clear ceiling where supply keeps entering the market. Meanwhile, the cloud below is acting as a safety net, catching any dips and bouncing price back up. As one analyst put it, "This creates a narrow decision range where price is effectively caught between overhead resistance and underlying support." Right now, IREN is trapped in this zone with buyers and sellers locked in a standoff, waiting for someone to make the first move.
⬤ These consolidation periods usually come before bigger moves once the balance finally breaks. If IREN pushes through $60 and holds it, that would signal buyers are back in charge and ready to push higher. But if the cloud support gives way, we're probably looking at another leg down. Until one of those scenarios plays out, IREN is range-bound, and traders are watching to see which side blinks first.
 Usman Salis


