 Marina Lyubimova
⬤ IREN Limited is trading slightly lower in today's session, holding around the $52 level after pulling back from recent highs. Despite the current dip, the technical setup looks pretty solid. The stock is maintaining a clear pattern of higher lows, which is exactly what you want to see in an uptrend.
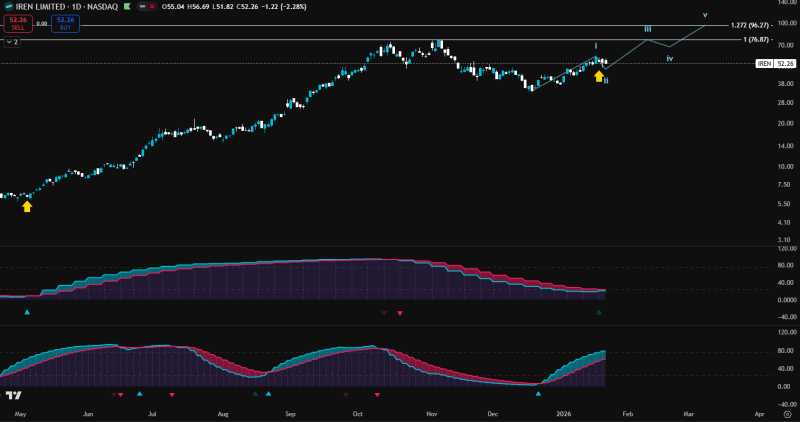
⬤ Here's where it gets interesting: both momentum indicators just flipped back to bullish. The last time this happened, IREN went on an absolute tear—jumping from around $6 all the way past $70. That's the kind of move that gets traders' attention. The chart shows Fibonacci projections pointing to an upper target near $96, which lines up with where this rally could be headed next.
⬤ Sure, the short-term action is a bit choppy right now, but the bigger picture still points higher. The stock keeps making higher highs and higher lows—that's textbook uptrend behavior. The recent weakness looks more like a healthy pause than anything broken. Those momentum indicators turning blue again suggest buying pressure is building after the late-2025 consolidation.
⬤ What makes this setup stand out is how well IREN is holding up despite the temporary softness. The stock is respecting key support levels while momentum recovers, showing there's still real interest from buyers. As long as the rising trend holds and momentum stays supportive, this technical picture keeps pointing toward continuation, not reversal. That $96 target remains very much in play.
 Marina Lyubimova


