 Saad Ullah
HIMS is sitting at a critical technical level as price compresses near the 200-week moving average. StockTrader_Max noted that the stock is hovering around this key level while searching for direction, with the broader structure hinting that a corrective phase may be nearing its end.
HIMS Stock Downtrend: The Move That Defined the Chart
The chart reflects a clear bearish structure following a major peak. Price has declined steadily, forming a sequence of lower highs and lower lows - a classic sign of sustained downside pressure.
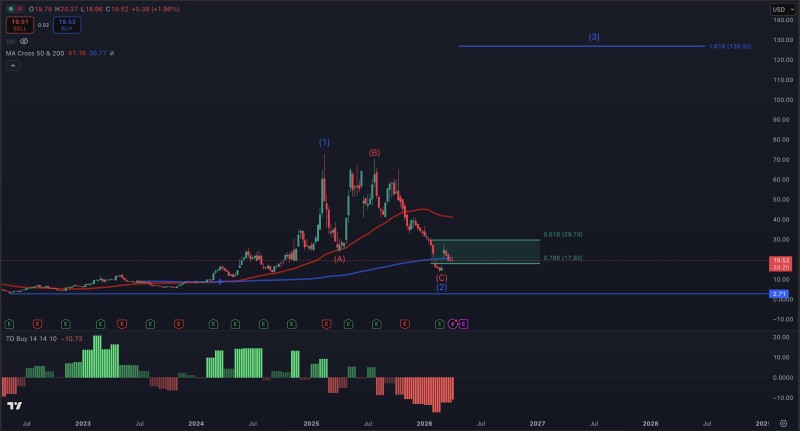
The stock is hovering around this level while searching for direction, with the broader structure hinting that the corrective phase may be nearing completion.
This shift in structure aligns with broader technical observations, where HIMS has remained in a prolonged downtrend with sellers maintaining control across multiple attempts to stabilize. The failure to reclaim higher levels has kept momentum weak, reinforcing the idea that the prior bullish phase has fully transitioned into correction. Traders watching HIMS stock downtrend deepens as bull flag fails at $60 will recognize this pattern as a continuation of the same bearish sequence.
Where HIMS Stock Price Meets the 200 WMA
The most important element in the current setup is the interaction with the 200-week moving average. Price is now sitting directly on this long-term level, which often acts as a key decision zone in technical analysis.
At the same time, the chart highlights a Fibonacci retracement area between approximately $17.9 and $29.7, adding confluence to the current region.
When HIMS tested major Fibonacci levels, buyers briefly stepped in but failed to confirm a full reversal - the overlap between moving average support and Fibonacci structure makes the current zone especially significant.
Similar reactions have been observed at prior key levels, where short-term buying interest emerged but lacked follow-through. This overlap between moving average support and Fibonacci structure makes the current zone especially significant. For broader context, HIMS stock down 60% as sellers hold full control at key support zone captures just how deep the damage has been.
HIMS Stock Correction: A Structure That Suggests Completion
The chart labeling indicates a potential ABC correction, with the latest move approaching the completion of wave (2). This aligns with the broader idea that price may be stabilizing after an extended decline.
The market is no longer trending aggressively downward, but it has not yet transitioned into a clear uptrend either.
However, it is important to note that the analysis does not confirm a reversal - only that the structure may be close to completing. Recent price behavior supports this cautious view, as HIMS continues to test support without a confirmed shift in control. Those tracking the HIMS stock eyes $17 dip before potential reversal scenario will find the current setup consistent with that thesis.
Compression Signals a Pending Move for HIMS Stock
Price action has tightened near the 200 WMA, with smaller candles and reduced volatility indicating consolidation. This type of compression often precedes a larger directional move.
Right now, the setup is defined by:
- Price holding at a major long-term average
- A completed or near-completed corrective structure
- Lack of strong bullish confirmation
This places HIMS in a neutral but highly reactive zone, where the next move will likely define the broader trend direction.
 Saad Ullah


