 Peter Smith

⬤ HIMS is trading sideways around $32 after sliding from highs above $60. The selling has cooled off, but buyers haven't shown up in force yet. Recent price action shows the stock is just treading water—neither breaking down nor breaking out. Right now, momentum tools are saying "not yet" to any big move.
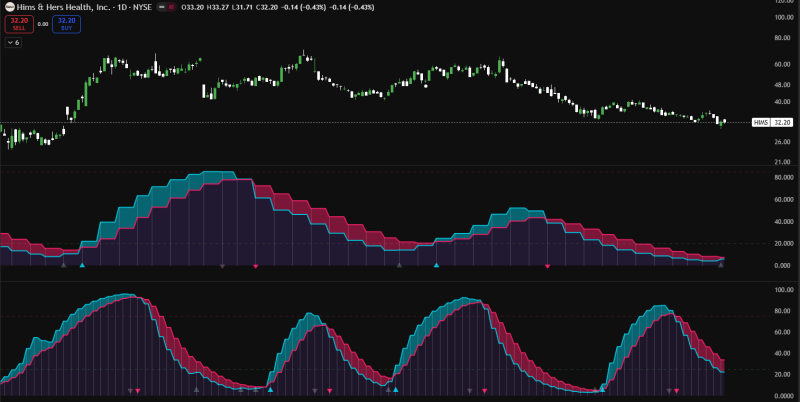
⬤ The slow stochastic indicator has been a solid predictor for HIMS in the past. When it turned bullish before, the stock ripped higher by 128% in one rally and another 32% later on. Those runs had momentum clearly shifting and price expanding fast. Today's chart tells a different story—both stochastic lines are stuck in the pink zone, meaning downside pressure is still hanging around instead of flipping to recovery mode.
⬤ The price structure backs up this cautious vibe. After topping near $60, HIMS has been making lower highs and lower lows in a steady downtrend. Recent candles show stabilization, but there's no higher-low pattern or momentum crossover that usually comes before a real rally. Without the stochastic turning up, the market's still working through the damage from the drop rather than gearing up for a fresh leg higher.
⬤ This waiting period matters because HIMS has a history of explosive moves once momentum clicks. But jumping in too early carries risk when the indicators haven't confirmed anything yet. Until momentum starts shifting higher, the stock will likely stay range-bound. Traders are watching to see if conditions develop into renewed strength or if consolidation drags on longer.
 Peter Smith


