 Sergey Diakov

⬤ GOOGL shares reversed higher after dropping into a critical support zone marked on the charts between roughly $294 and $300. The pullback brought the stock into what's known as the "blue box" area—a region defined by Fibonacci extension levels that often acts as a floor. After several days of weakness, the price found buyers in this zone and has since bounced back above $310, heading toward $315.
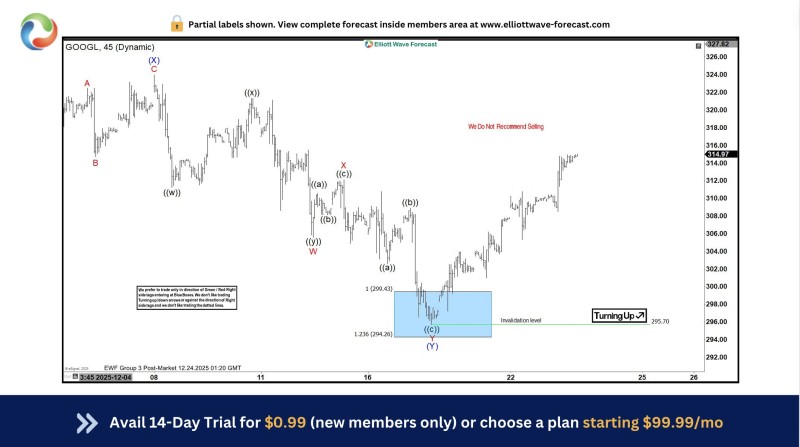
⬤ Looking at the 45-minute chart through an Elliott Wave lens, the decline appears to have completed a corrective pattern that bottomed near the 1.236 extension at about $294.26. That's where the selling exhausted itself and the stock turned around. The chart marks $295.70 as the key level—if GOOGL drops below that, the bullish setup breaks down. But for now, the structure suggests the rebound is real.
⬤ During the pullback, GOOGL moved in choppy, overlapping waves before stabilizing in that blue box support area. Once it hit those levels, downside pressure dried up and buyers stepped in, pushing the stock to form higher highs and higher lows. As long as those recent lows hold, the bounce from support looks like it's playing out as expected.
⬤ Why this matters: it shows how technical support zones and Fibonacci levels continue to guide short-term moves in GOOGL. If the stock keeps climbing from the $294-$300 area, it could steady sentiment around Google shares after the recent slide. But if it fails to stay above that support band, traders will need to rethink the current bullish view.
 Sergey Diakov


