 Saad Ullah

⬤ Alphabet Inc. has slipped into what technical analysts call the "Blue Box" zone after getting rejected near recent highs. The stock peaked above $330 before falling back to the low $300s, landing right in a support area that Elliott Wave traders have been watching closely. This pullback represents a typical corrective phase rather than a major trend shift.
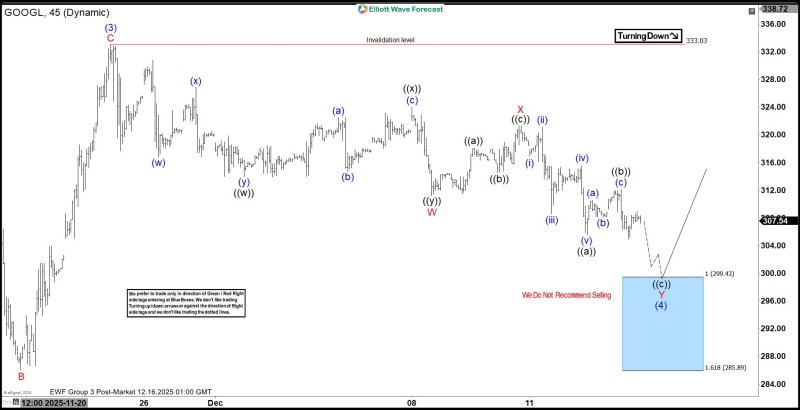
⬤ The Elliott Wave pattern shows Alphabet trading around $307 after its drop from $333, placing it squarely within the highlighted support range of $299 to $286. This zone marks where wave Y of a broader wave (4) correction is expected to complete. These types of formations usually signal a pause in the bigger trend rather than a full reversal, giving the stock room to reset before potentially moving higher again.
⬤ What makes this zone interesting is that it's considered a reaction area where selling pressure typically fades. The technical setup suggests buyers might step in here rather than the decline continuing much further. With GOOGL sitting in the upper part of this $299-$286 range, it's positioned at levels that previously acted as consolidation points during earlier parts of this corrective move.
⬤ For the broader market, this matters because Alphabet carries significant weight in major stock indices. If the stock stabilizes or bounces from this support zone, it could lift sentiment across big tech stocks. On the flip side, if it breaks below $286, we might see more short-term volatility spill over into the wider market.
 Saad Ullah


