 Eseandre Mordi

⬤ AST SpaceMobile (ASTS) dropped back to its 20-day simple moving average in the $104–$105 zone—a key technical support level that's been holding up the recent rally. The stock's now sitting right on this line, and traders are watching to see if it bounces or breaks.
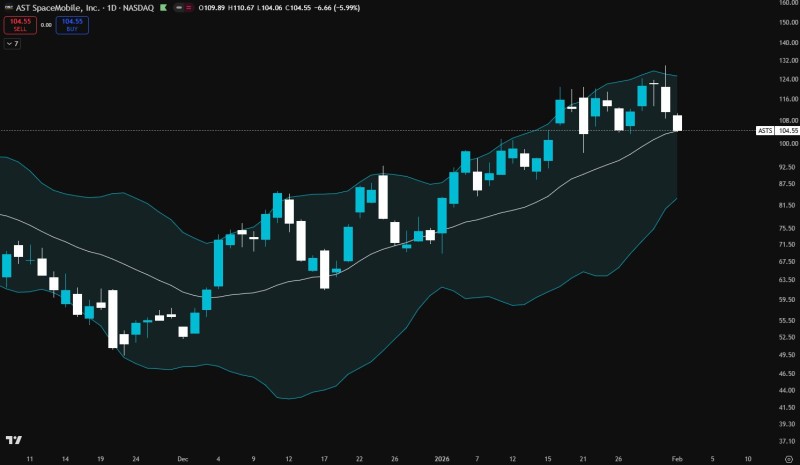
⬤ ASTS had been climbing steadily for weeks, riding above that 20-day line and pushing toward recent highs before sellers showed up. Now we're seeing a pullback that's testing whether that support can hold. The stock hasn't crashed through it yet—it's just retraced to touch it, which puts everyone in wait-and-see mode.
⬤ The Bollinger Bands show ASTS trading right at the middle band, which lines up with that 20-day average. The stock's no longer stretched toward the upper band like it was during the rally—momentum's cooling off, but this isn't a full reversal yet. What happens next at this level matters.
⬤ This is where the rubber meets the road for ASTS bulls. If the stock holds above $104-$105 and that 20-day line, the uptrend stays alive. If it fails here, we could see more selling or a deeper pullback. With price sitting exactly where everyone's watching, the next few sessions should tell us where smart money thinks this is headed.
 Eseandre Mordi


