 Marina Lyubimova

⬤ AST SpaceMobile shares kept showing strong upward momentum on the monthly timeframe, with ASTS extending its advance and staying above key technical guides. The chart shows a steady sequence of higher highs and higher lows, highlighting the broader uptrend's persistence. Recent monthly candles look constructive, reflecting sustained buying interest as price trades near the $110 area.
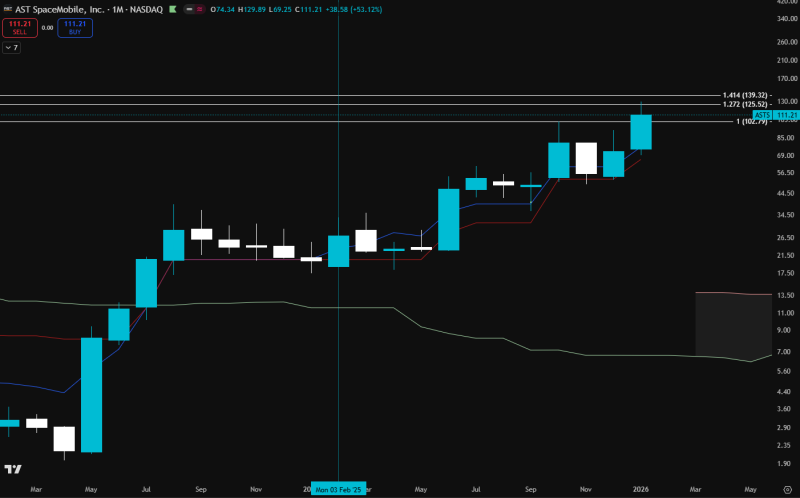
⬤ ASTS has been riding its conversion line higher on the longer-term chart. Price has consistently respected this rising line, with pullbacks staying limited and getting quickly absorbed. The structure points to trend continuation rather than exhaustion, as the stock keeps building on earlier gains.
⬤ The chart shows ASTS climbing from much lower levels earlier in the trend and now approaching clearly marked horizontal reference zones. Levels near $125 and $139 stand out as potential interaction areas based on plotted extensions and resistance markers. Despite the strong rally, there's no sign of a breakdown below trend support or violation of the prevailing structure. The monthly setup remains orderly with no abrupt reversals or destabilizing price action.
⬤ This price behavior matters for broader market conditions since sustained strength on a monthly timeframe usually reflects durable momentum rather than short-term volatility. AST SpaceMobile's ability to hold its uptrend while approaching higher resistance zones shows how technical structure guides longer-term price behavior. As ASTS tests higher levels, market focus stays on whether the stock consolidates constructively or extends its advance further, shaping sentiment around high-growth and tech-oriented names.
 Marina Lyubimova


