 Peter Smith
⬤ Apple is releasing its earnings this Thursday, and while day-to-day price moves might grab headlines, what's happening on the quarterly chart is what really matters. The short-term reaction to earnings won't change the bigger picture that's forming on longer timeframes. Right now, Apple's trading near all-time highs, and the technical setup at these elevated levels is starting to raise eyebrows.
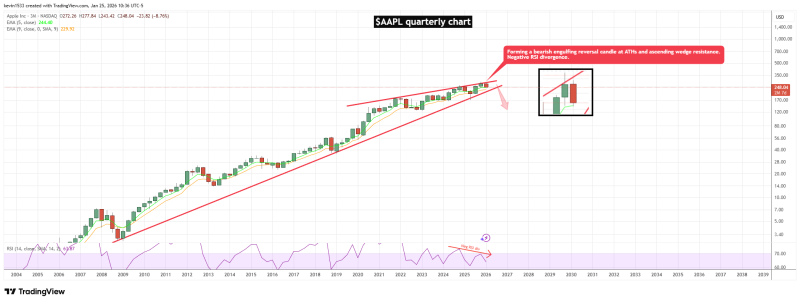
⬤ Looking at the quarterly chart, AAPL appears to be forming a classic bearish engulfing pattern right at its peak. There's a large red candle starting to swallow up the previous green one near the top of a years-long uptrend. When you see this kind of reversal pattern after such a long climb, it's worth paying attention to—it often signals more than just a temporary dip.
⬤ The momentum indicators aren't looking great either. The quarterly RSI is showing negative divergence, meaning while Apple's price keeps hitting new highs, the momentum behind those moves is actually weakening. It's like a car running out of gas even though it's still moving forward. This divergence on higher timeframes usually means buying pressure is fading, especially when you're also seeing reversal patterns form.
⬤ Here's why this matters: regardless of what happens with Thursday's earnings report, this quarterly structure is the real story. Even if there's some short-term volatility after the announcement, the longer-term chart is what'll dictate where Apple heads next. Trading at these stretched valuations with a potential bearish engulfing pattern and weakening momentum creates a setup that could influence not just Apple, but the entire big-tech sector and broader market.
 Peter Smith


