 Eseandre Mordi

⬤ Amazon's still trading close to record territory, with weekly charts showing prices hanging around the $230 zone after a solid multi-year comeback. The stock's showing a steady uptrend, but something's changed beneath the surface when it comes to how the market's pricing it.
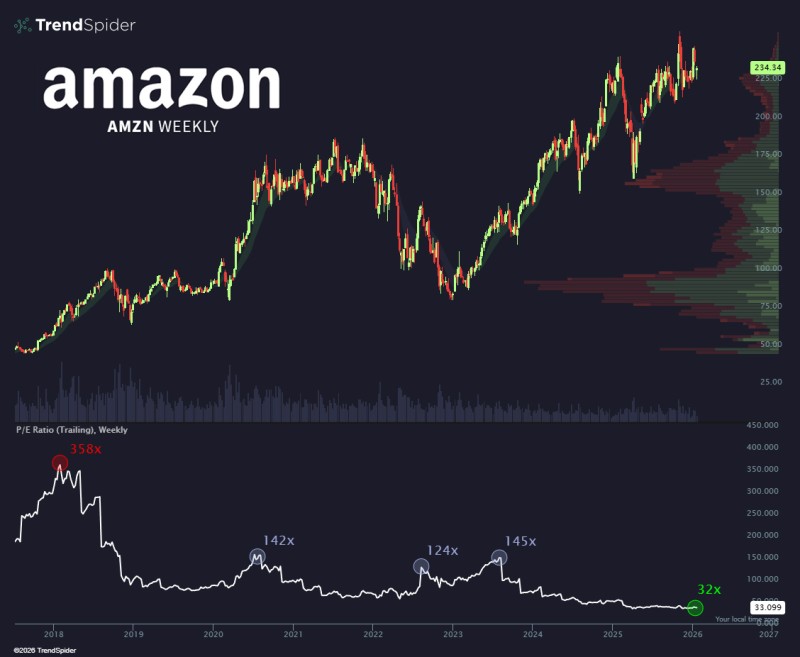
⬤ Here's where it gets interesting: Amazon's trailing price-to-earnings ratio has dropped dramatically. Back in 2018, the valuation peaked near 358x. During the 2020 rally, it sat around 142x, and in 2023 it was roughly 145x. Now? The most recent reading puts the trailing P/E near 32x—a massive drop even though the stock's trading near historical highs. What we're seeing is valuation coming back down to earth while the price keeps climbing.
⬤ From a technical standpoint, Amazon's maintaining a solid long-term trend. After hitting bottom below $100 during the 2022 selloff, the stock's been making higher highs and higher lows—textbook recovery pattern. Current prices are sitting above key resistance zones that used to hold it back, and volume patterns suggest real buying interest rather than speculative froth. That falling P/E multiple? It's telling us earnings growth is finally catching up with the share price.
⬤ This price-versus-valuation split matters beyond just Amazon. As a core holding in major indices and a bellwether for large-cap growth, what happens here ripples through the broader market. A declining P/E alongside rising prices changes how traders and investors think about risk, growth sustainability, and earnings quality across tech and consumer sectors. The chart shows how a leadership stock can keep pushing higher while its valuation resets—and that dynamic shapes market sentiment across the board.
 Eseandre Mordi


