 Victoria Bazir

⬤ Amazon's stock is finding its footing on the weekly chart after a pretty uneventful stretch so far in 2025. The shares are starting to show clearer price patterns after months of going nowhere fast. Right now, Amazon is trading within a range that's been tested multiple times, suggesting traders are taking their time to figure out what comes next rather than making any sudden moves.
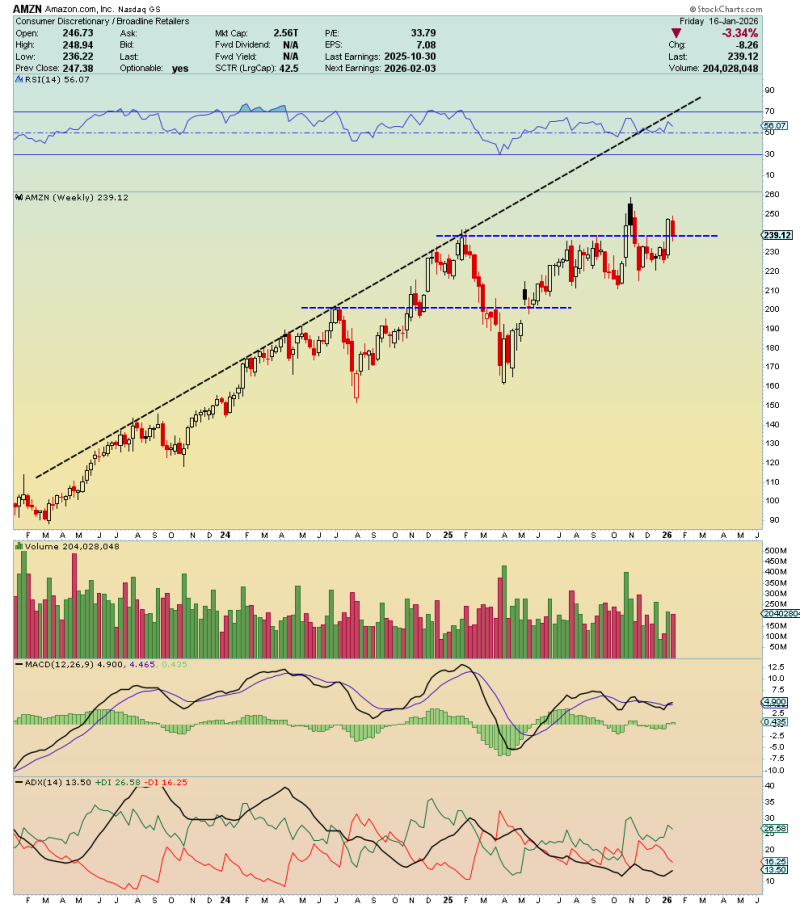
⬤ Looking at the weekly timeframe, Amazon is sitting in the $239 to $246 zone—an area that's been a battleground between buyers and sellers for a while now. What's interesting is that the stock is still holding above a multi-year rising trendline that's been supporting the broader uptrend. As long as the price stays above the lower edge of this zone, the long-term picture stays positive.
⬤ The momentum side of things shows stabilization more than anything else. The RSI is hovering around the middle, which means there's no sign of the stock being stretched too far in either direction. Volume has been pretty normal compared to recent weeks—no panic selling, but no big buying rushes either. The MACD is flattening out, which tells you momentum is taking a breather rather than signaling any major trend change.
⬤ This matters for the broader market because Amazon carries serious weight in the major indexes and represents both consumer spending trends and tech-driven growth. If the stock can hold this consolidation pattern, it could keep confidence alive in the longer-term uptrend. But if it breaks below this range, you might see some sentiment shifts ripple through related sectors. For now, Amazon's weekly chart is worth watching as a gauge for overall market direction and how much risk investors are willing to take on.
 Victoria Bazir


