 Usman Salis
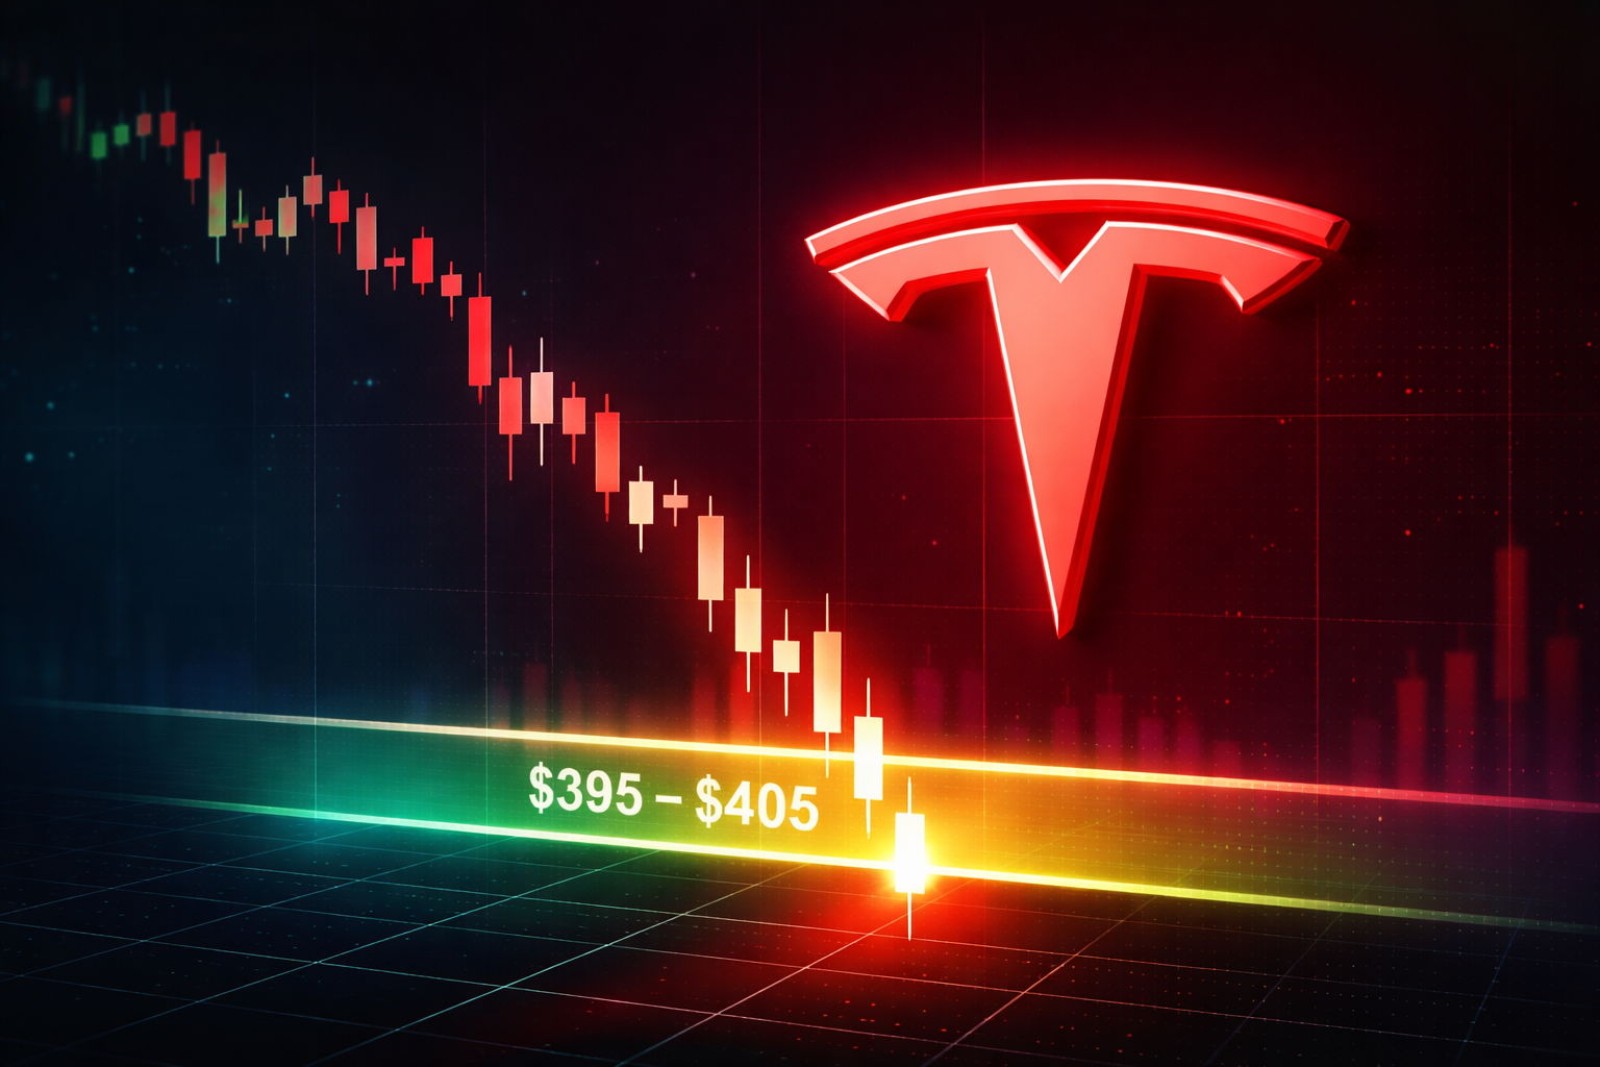
⬤ Tesla's hit a technically important zone after dropping from recent highs. Looking at the 4-hour chart, TSLA's moved into what Elliott Wave traders call an "extreme pullback zone"—basically an area where buyers have historically stepped back in after corrections. The stock's now trading around the $395–$405 range, and according to chart analysts, this setup usually triggers at least a short-term three-wave recovery bounce.
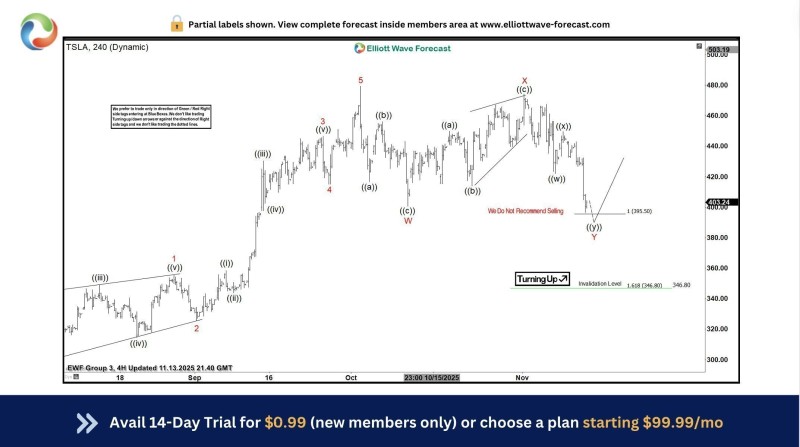
⬤ Here's what the chart's showing: Tesla completed an upward run, then pulled back with overlapping candles and slowing downward momentum. The selling pressure picked up during the drop, sure, but there's no strong follow-through suggesting this is the beginning of a full bearish reversal. Instead, it looks more like a healthy correction within the bigger uptrend—think of it as the stock catching its breath rather than rolling over completely.
⬤ The bigger picture still looks bullish. The chart includes a clear invalidation level well below current prices, meaning as long as Tesla holds above that floor, the broader uptrend structure stays intact. What we're seeing now fits the pattern of a "wave Y pullback"—a technical formation that typically comes before a measured bounce, not extended weakness. Chart watchers are even noting that selling into this zone goes against how similar setups have played out before.
⬤ Why this matters for the market: Tesla's still a heavyweight in large-cap growth and the EV sector, so what it does here carries weight. If TSLA stabilizes or bounces from this pullback zone, it signals consolidation within an ongoing uptrend rather than a structural breakdown. Right now, the price action looks like cooling momentum after some volatility—and technically speaking, conditions favor a corrective bounce over any real trend deterioration.
 Usman Salis


