 Saad Ullah

⬤ Amazon's stock is sitting at a crucial technical crossroads right now. The price is hugging a rising support trendline while bumping up against overhead resistance near the 50-day moving average. The daily chart shows AMZN consolidating just below this moving average and a short-term descending resistance line, setting up what could be a decisive move in either direction.
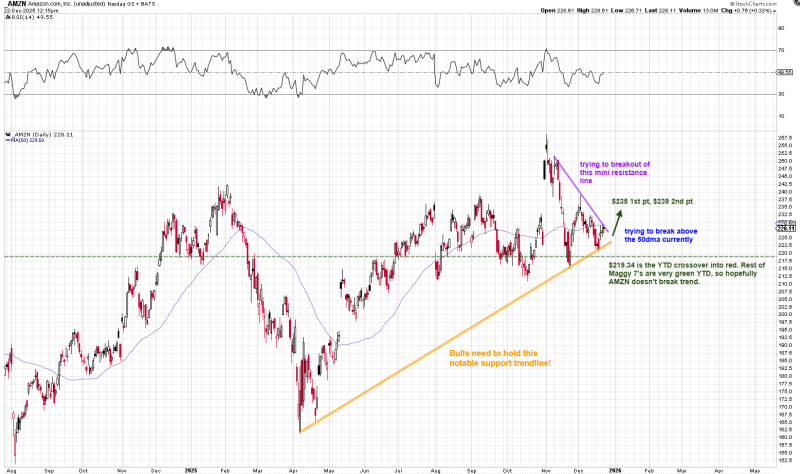
⬤ The stock has been holding steady above $219.34—a key reference point that represents the year-to-date crossover level. Staying above this level means Amazon closes the year in the green, which is psychologically important for investors. The 50-day moving average is acting as a ceiling right now, keeping a lid on upside momentum during recent trading sessions.
⬤ That orange ascending trendline on the chart? It's been guiding AMZN higher from earlier lows and continues working as critical support. As long as price stays above this trendline, downside risk looks limited. If resistance gets cleared, the chart points to $235 as the first upside target, with $239-$240 as a secondary zone—assuming the broader market stays cooperative.
⬤ Why does this matter? Amazon's price action at these levels could influence sentiment across big-cap tech stocks. Holding above structural support while testing moving average resistance keeps things constructive. But if AMZN loses that $219.34 level, the setup weakens and we're back to watching consolidation. Traders will be keeping close tabs on how Amazon behaves around these levels as it works toward breaking out of this range.
 Saad Ullah


