 Saad Ullah

⬤ Amazon stock is catching traders' attention as it hovers around major long-term support levels on the daily chart. The price is sitting right near its 200-day moving average after pulling back from recent highs, and chart watchers are spotting what could be a bottoming pattern forming. This looks like a solid long-term entry point when you consider both the valuation and how the company's actually performing right now.
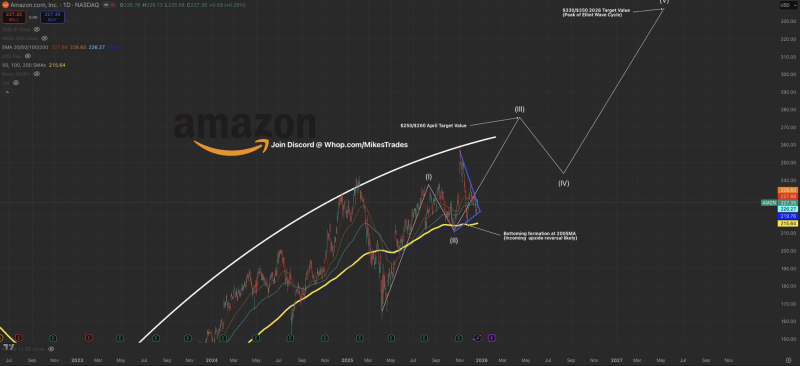
⬤ Despite the recent correction, the bigger picture still points upward. Technical markers suggest a near-term bounce could push the stock toward the $250-$260 zone over the next few months. Looking further out into 2026, projections extend all the way to the $330-$350 range if current support continues to hold. That 200-day moving average is being treated as the line in the sand here—it's the key level everyone's watching in this price analysis.
Amazon is being viewed as a long-term opportunity at current levels, the analyst noted, pointing to both technical setup and fundamental strength.
⬤ The bullish case isn't just about chart patterns. Amazon's recent numbers are backing up the optimism—earnings per share jumped over 36% year-over-year, revenue climbed nearly 13%, and profit margins improved by roughly 38%. These metrics show the business is actually firing on all cylinders even while the stock's been consolidating, which gives the technical setup some real fundamental backing.
⬤ Amazon isn't just another stock—it's a major piece of the big equity indexes and a bellwether for both tech and consumer spending. When a name this size stabilizes at long-term support with clear technical levels mapped out, it tends to influence sentiment across the entire large-cap space. Whether this support holds or breaks could shape how investors think about leadership stocks, growth sustainability, and where the broader U.S. market heads next.
 Saad Ullah


