 Artem Voloskovets
⬤ AMD is holding near the 0.618 Fibonacci retracement level following a significant decline on the daily chart. The 0.618 level at $194.27 is providing support, with AMD currently trading around $199.15 after a 7.39% pullback. The price is responding to a demand zone while staying above deeper support levels that haven't been tested yet.
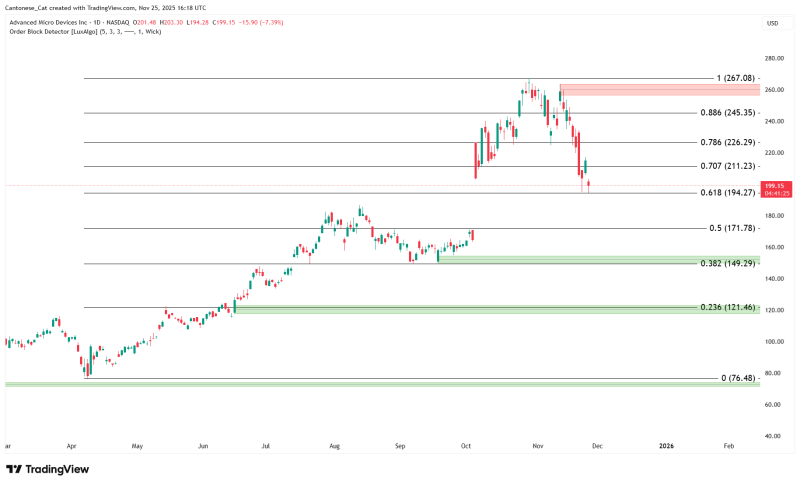
⬤ The chart shows AMD's reversal from its peak near $267.08, which aligned with the 1.0 Fibonacci level and a supply zone. Since that high, AMD has broken through several retracement levels, including 0.886 at $245.35 and 0.786 at $226.29, before settling near the current 0.618 level. There's a visible gap below the current price, and recent price action shows buyers are stepping in at this support zone.
⬤ Lower demand zones are marked on the chart, including areas around the 0.382 retracement at $149.29 and the 0.236 level at $121.46. These represent previous accumulation zones, though AMD is trading well above them. Current candles show recovery attempts right at the 0.618 level, suggesting buying interest despite the recent decline. The long-term trend structure remains upward, with retracement levels providing context for the ongoing correction.
⬤ The 0.618 retracement typically serves as a key support level during pullbacks in trending markets. With AMD reacting at this Fibonacci level and showing activity within the demand zone, the next few sessions could determine whether the stock establishes a base here or drops toward lower targets. The combination of the unfilled gap, the demand region, and this critical Fibonacci level makes this a technically significant moment for AMD's near-term direction.
 Artem Voloskovets


