 Usman Salis

⬤ Advanced Micro Devices (AMD) continued its slide this week, getting closer to a major technical support area that's caught a lot of attention. The stock is approaching a confluence zone near the 200-day moving average and the 0.618 Fibonacci retracement—levels that many traders see as critical for figuring out what happens next. Right now, AMD is trading around $204, with the 0.618 Fib level sitting at about $149.62 and the 200-day moving average marked at roughly $148.50.
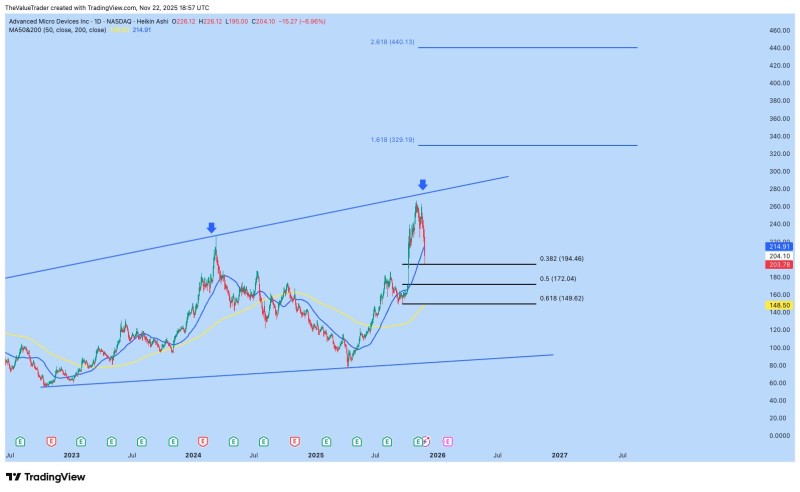
⬤ The pullback follows a strong rally earlier this year when AMD briefly hit the upper boundary of its long-term price channel before reversing lower. The drop from recent highs has brought the stock back toward key structural support, with intermediate Fibonacci levels at $194.46 and $172.04 marking the path down. There's strong bullish interest building at the lower support zone, which highlights how important this 0.618 area could be as a potential reversal point. The chart pattern shows similarities to previous cycles where AMD bounced hard after hitting similar long-term trend levels.
⬤ Market attention on AMD remains high because the confluence area between roughly $148 and $150 carries both technical and psychological weight. The combination of a major Fibonacci retracement and the 200-day moving average often acts as a magnet for renewed buying after extended declines. While AMD is still trading above those levels, the correction has stayed orderly, showing that traders are carefully watching the next phase of this move.
⬤ This matters because AMD is central to the broader semiconductor sector, and large-cap chip stocks often set the tone for sector performance during consolidation periods. How AMD reacts at the 200-day moving average and 0.618 Fibonacci retracement could shape expectations for semiconductor momentum heading into 2026 and offer fresh insight into the sector's underlying strength.
 Usman Salis


