 Marina Lyubimova
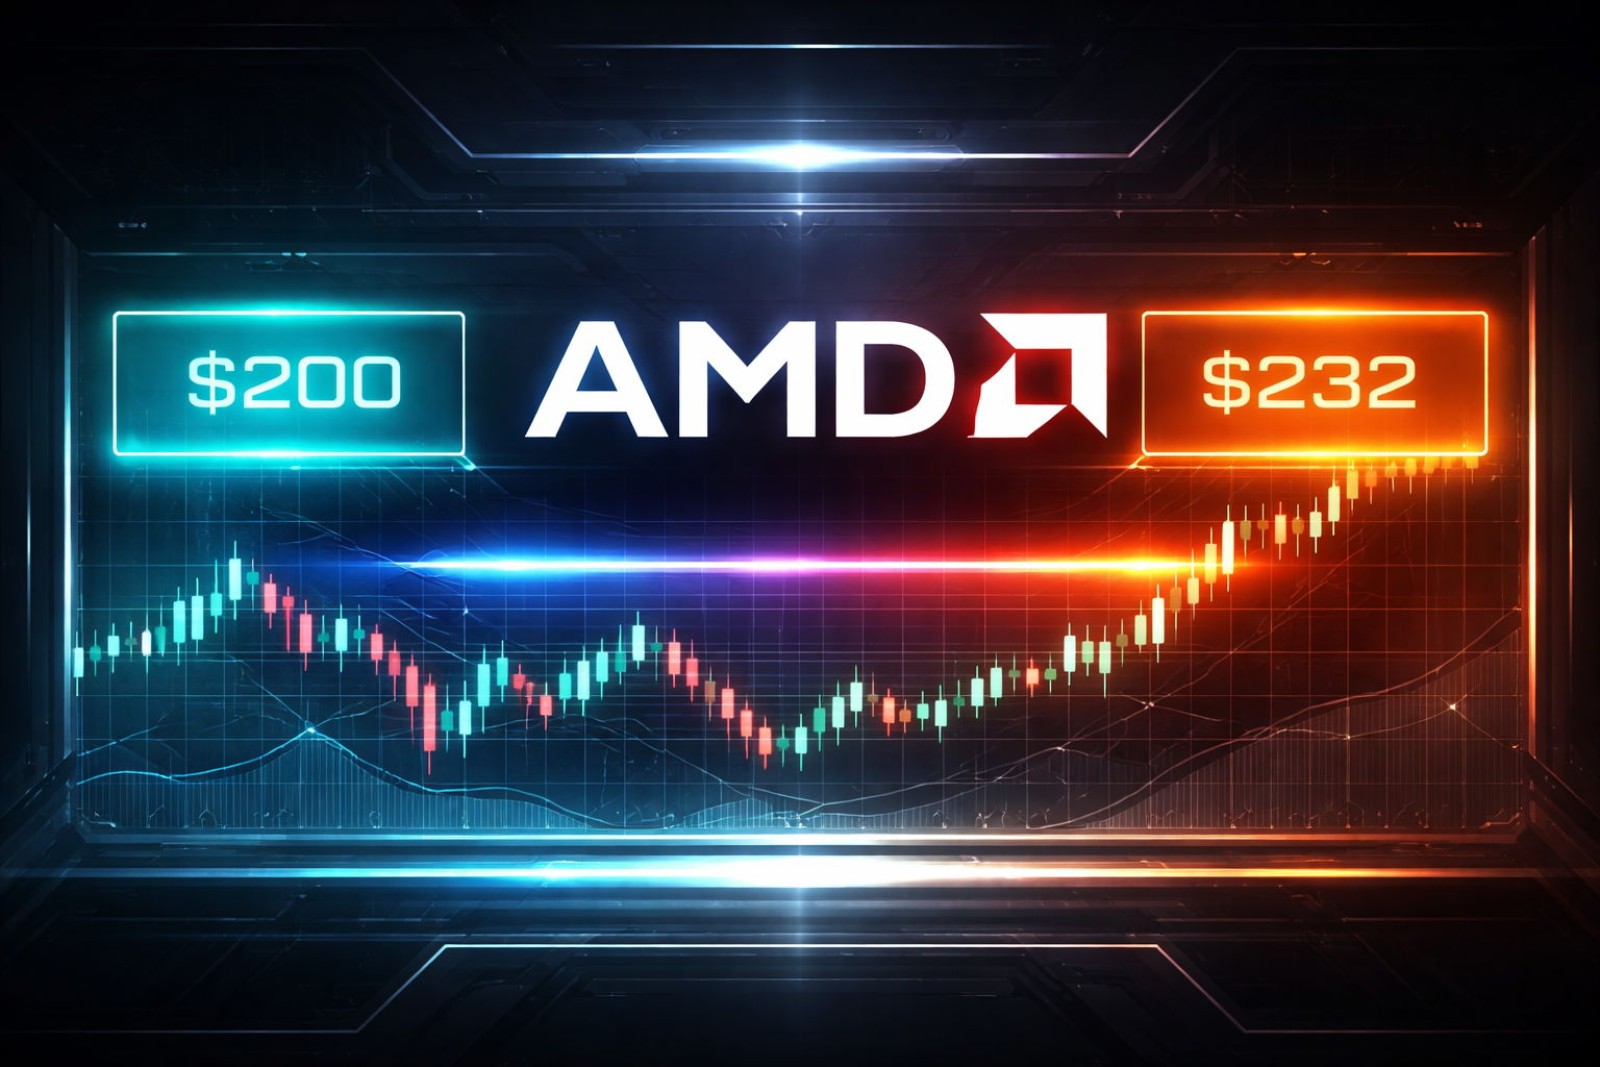
⬤ AMD is trading in an increasingly tight range around $232, sitting comfortably above solid support at $200 while bumping up against a downward-sloping resistance line. This squeeze setup shows volatility shrinking as the price channel gets narrower—a classic sign that something bigger might be brewing.
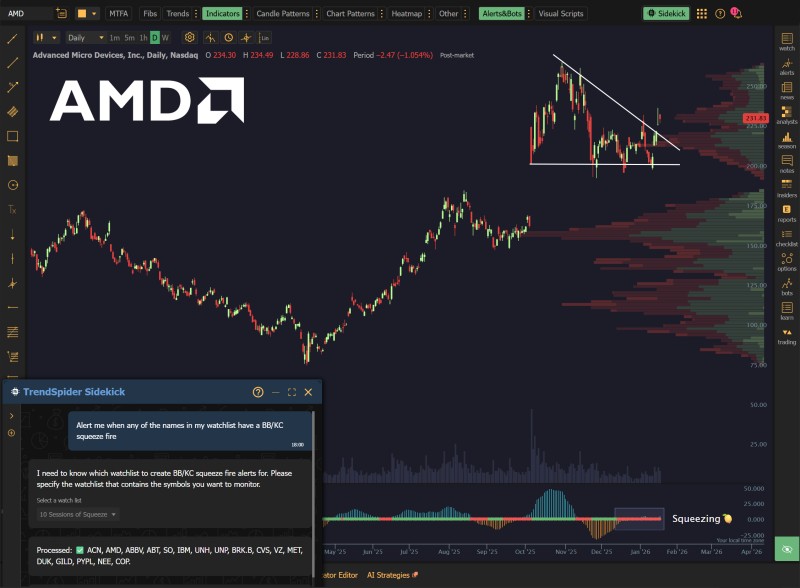
⬤ The compression is pretty clear on the chart: lower highs keep pushing down while support holds steady. Trading volume has dropped off during this consolidation, which tells us most traders are sitting on their hands, waiting to see which way things break. AMD's already bounced hard from its mid-2024 lows, so this sideways action looks more like a breather than any kind of reversal.
⬤ The squeeze indicator confirms what the price action is showing—volatility is contracting after an earlier expansion phase. These setups usually come before bigger moves, but the chart isn't tipping its hand yet on direction. For now, AMD is stuck between that descending trendline resistance and the $200 floor, keeping price action locked in this tightening pattern.
⬤ This matters beyond just AMD since it's a heavyweight in the semiconductor space and moves the tech sector. When major tech names compress like this, the breakout often carries weight for broader market momentum. Until AMD pushes outside these boundaries, it's in a technical standoff—and whichever way it resolves will likely influence how traders view the whole sector.
 Marina Lyubimova


