 Saad Ullah

⬤ AMD recently pushed higher before pulling back, but trading volume has bounced back strongly. The stock now sits at a critical inflection point around $230.25. If shares close above this level on the weekly chart, it would form a bullish engulfing candle—a classic technical signal that often marks the start of a new uptrend.
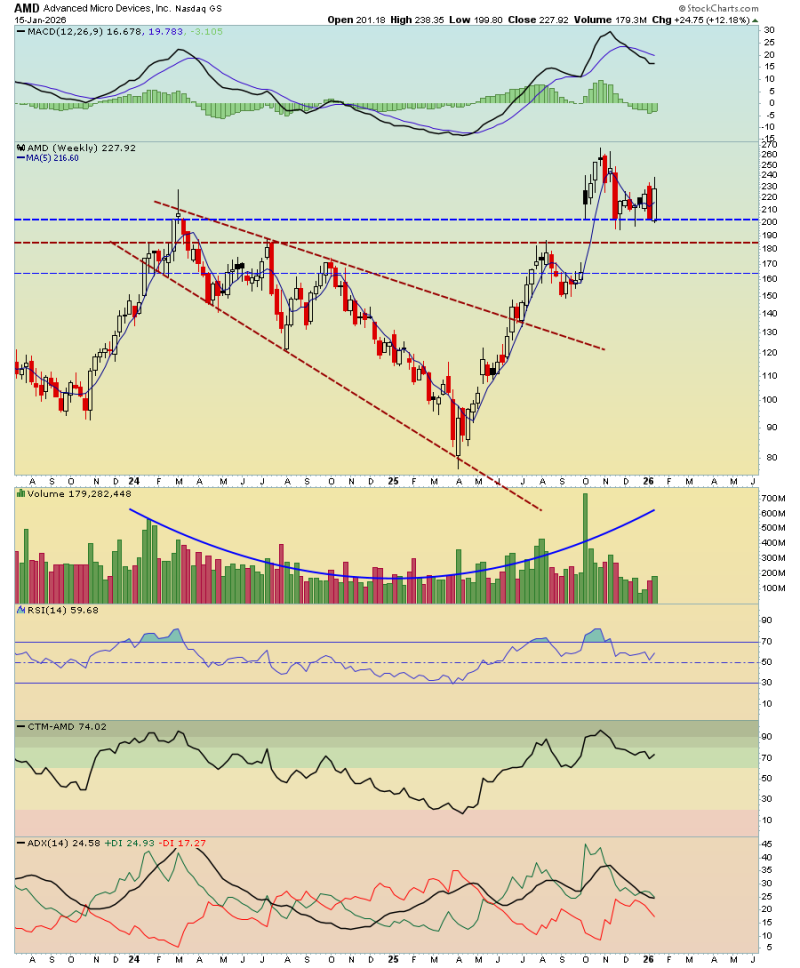
⬤ The weekly chart shows volume picking up again after the pullback, suggesting fresh interest from buyers. A close above $230.25 would confirm the bullish engulfing pattern and signal that the recent downtrend is likely over. This setup typically points to more upside ahead for the semiconductor giant.
⬤ Volume has been the real story here. The spike in activity during both the surge and pullback shows serious participation. With the stock approaching $230.25, traders are watching closely for that weekly close confirmation. A clean break above this level could fuel a push toward new highs in the coming weeks.
⬤ This $230.25 level matters because crossing it would represent a major technical shift for AMD. It would signal changing sentiment and potentially kick off a fresh upward trend. Breaking through could draw even more attention to the semiconductor sector and reinforce bullish momentum acro
 Saad Ullah


