Peter Smith

Advanced Micro Devices has been on fire this year, and the chart suggests the rally isn't over yet. After breaking out of a long-term downtrend and hitting multiple price targets, AMD is now consolidating in a classic bull flag pattern—a setup that often precedes another explosive move. With big institutional players piling into November $295 call options and the stock holding strong above key support, traders are eyeing a push toward new all-time highs in the coming months.
The Technical Setup
Technical analyst Mike Investing's chart shows AMD in textbook bullish form. The stock has already hit its initial targets around $180–$200 and then $230–$250.
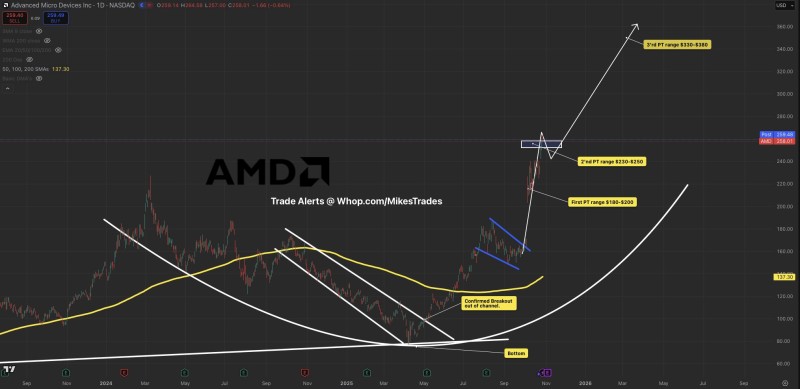
Now trading near $260, it's consolidating just below the next major resistance zone with a projected target of $330–$380.
Here's what makes the setup compelling:
- Confirmed breakout from a long-term descending channel that dominated early 2024
- Bull flag pattern forming after a sharp run-up, suggesting continuation rather than exhaustion
- Rising parabolic support showing strong momentum underneath current price action
- 200-day moving average trending upward around $137, far below current levels
- Key breakout level at $265–$270 that could trigger the next rally leg toward $300+
Why AMD Keeps Climbing
AMD's chart isn't the only thing looking strong. The company's MI300 AI chips are gaining serious traction with cloud providers, positioning AMD as a credible alternative to Nvidia in the AI infrastructure boom. That's caught the attention of major investors—"whales" have been loading up on call options betting AMD will push past $280 soon.
If AMD breaks above $270, the path toward $330–$380 opens up. Even if there's a short-term pullback toward $230–$250, the broader structure remains bullish. With technicals, fundamentals, and investor sentiment all aligned, AMD looks ready for another 10–20% spike heading into 2026—and possibly a run at new record highs.
 Peter Smith