 Saad Ullah

⬤ AMD has reached a technically critical point as its monthly chart reveals exhaustion signals after years of gains. The stock appears to be completing a decade-long advance forming a large leading diagonal pattern with a strict 3-3-3-3-3 subdivision. This structure suggests the broader uptrend is losing steam as prices struggle to hold higher ground.
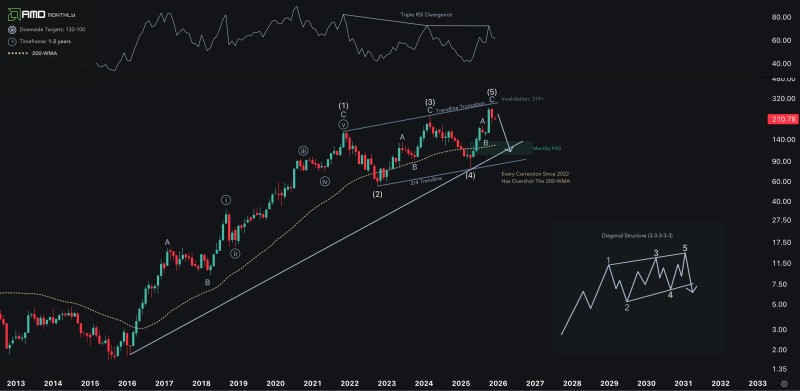
⬤ The most recent wave five failed to touch the upper boundary of the diagonal channel—a bearish truncation signal. The Relative Strength Index shows a triple divergence on the monthly timeframe, confirming weakening momentum at current price levels.
⬤ If AMD breaks below the long-term trendline from the 2016 lows, the focus shifts to the lower 2/4 trendline and a monthly fair value gap between $130 and $100. Every major correction since 2022 has pushed beyond the 200-month moving average, making this lower zone a likely target for a deeper reset.
⬤ As a major semiconductor bellwether, AMD's technical setup carries wider market implications. While the long-term growth story remains intact, the stock may need consolidation before resuming higher. The bearish scenario is invalidated above $319, but until then, AMD likely needs time to rebuild momentum and create a more stable foundation for its next major move.
 Saad Ullah


