 Marina Lyubimova

⬤ AMD shares are trading around $252–253, holding above key technical levels after a steady climb from earlier lows. Recent sessions have shown controlled consolidation near highs, with the stock delivering a substantial multi-month advance that underscores its strong performance in the semiconductor sector.
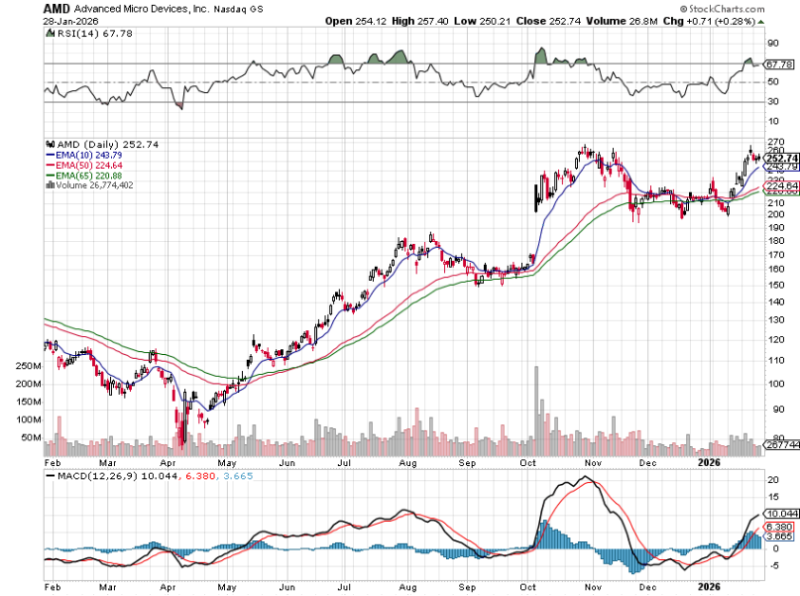
⬤ The chart shows a technically solid setup—AMD is trading above its 10-day, 50-day, and 200-day exponential moving averages, which remain positively aligned and signal trend consistency. The Relative Strength Index sits in the upper-60s, reflecting firm momentum without hitting extreme overbought territory.
⬤ Trading volume recently came in around 26–27 million shares, consistent with recent averages and supportive of the current trend. The MACD indicator stays positive, with the signal line trending higher after recovering from a late-year dip. Since early 2026, AMD has been forming higher lows along rising moving averages, suggesting buyers keep stepping in on minor pullbacks.
⬤ AMD's price action matters because the stock often serves as a sentiment gauge for the broader semiconductor and tech sectors. When AMD holds strength near highs with technical momentum intact, it can influence sector-wide performance. The upcoming sessions will likely show whether the stock pushes higher or settles into sideways consolidation after its strong run.
 Marina Lyubimova


