 Marina Lyubimova

⬤ Advanced Micro Devices (AMD) is catching eyes again as the stock finds its footing after a rough slide from recent peaks. Trading around $198 after pulling back from above $260, AMD is showing signs of stabilization that have technical analysts paying attention. The daily chart reveals the stock holding above its long-term rising trend line while shorter-term indicators start to align after weeks of downward movement.
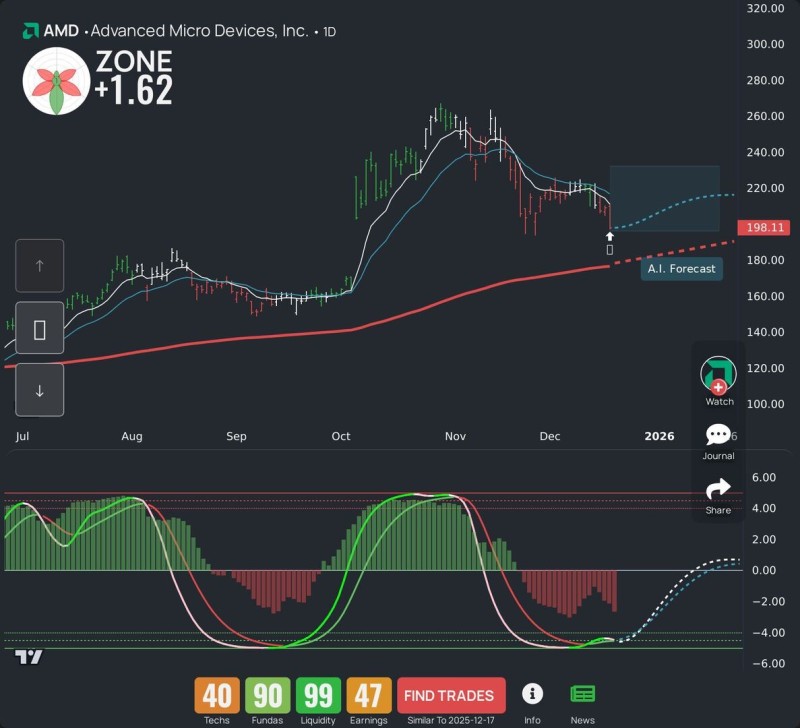
⬤ The technical picture shows AMD consolidating rather than collapsing. Price action has tightened up with lower volatility and narrower trading ranges—the kind of setup that often comes before the next big move. What's encouraging is that despite the sharp correction, the stock hasn't broken through its major structural support levels. The thick red trend line on the chart continues to act as a floor, suggesting the broader uptrend remains intact.
⬤ Momentum readings are starting to look healthier too. The indicators at the bottom of the chart are climbing out of deeply oversold territory, similar to patterns that preceded earlier rallies this year. There's even an AI-generated forecast zone on the chart projecting a potential recovery path if current support holds. While nobody's calling it a sure thing, the visual suggests stabilization first, then gradual upside rather than another leg down.
⬤ This matters because semiconductor stocks have been all over the place lately, reacting to every shift in AI spending sentiment. AMD's extended rally got overheated, and this correction has cooled things off and reset positioning. Whether the stock can build a solid base here or kick into recovery mode could set the tone for other big chip names as we head into 2026.
 Marina Lyubimova


