 Marina Lyubimova

⬤ Advanced Micro Devices stock has been showing some stability after pulling back from its November peak. The daily chart points to price consolidation happening near short-term support, with the butterfly curve pattern acting as a floor. Key levels to watch sit at 221, 227, and 232 as we move through the final days of the year. Right now, $AMD is trading around 215, bouncing back a bit after some early December weakness.
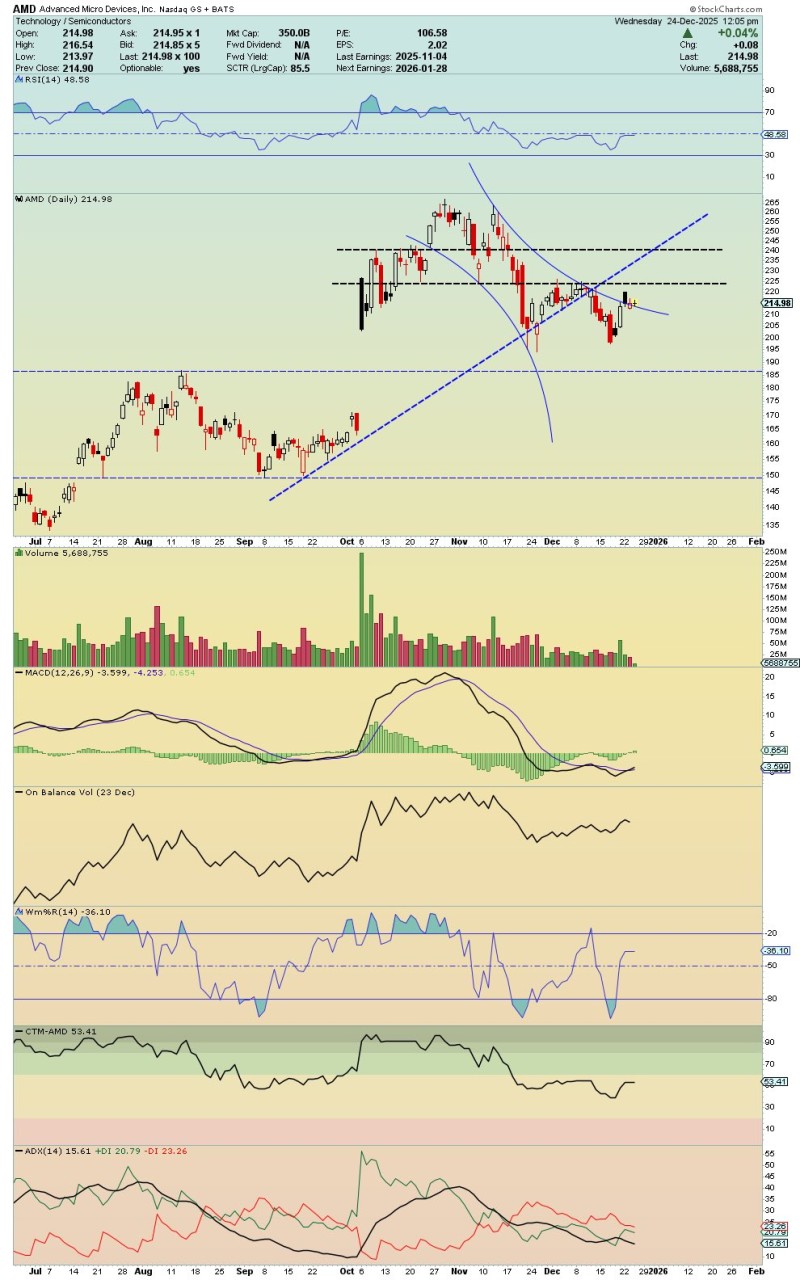
⬤ Looking at the chart, you can see where price broke below an upward trend line and then went through a rounded decline before settling into a base between 200 and 210. The RSI is hanging around 50—pretty neutral territory—while the MACD has started to flatten out after some downward pressure. Volume's been moderate compared to the heavier action we saw during October's rally. The stock seems to be working to hold above support that lines up with where it consolidated before.
⬤ Those price points at 221, 227, and 232 show up as important markers on the chart—they match up with areas where the stock has reacted before. These could become checkpoints if momentum starts building again from current levels. Despite the recent pullback, the bigger picture still looks decent over the medium term, with $AMD trading well above the major lows that came before its fall run-up.
⬤ This matters because AMD plays a major role in the semiconductor and AI space, where technical moves often ripple through the broader market. How the stock handles support shows just how closely traders are watching whether it can work its way back toward that 221–232 zone. If consolidation holds above here, it keeps the setup neutral to constructive. But if weakness returns, attention will shift back to the lower end of the recent range as everyone gauges what's really going on under the hood.
 Marina Lyubimova


