 Usman Salis

Amazon just hit one of those technical spots that separates the winners from the losers. The stock's sitting right on its 21-week moving average near $220 - a level that's been rock solid support before. Trading at $220.77 with a daily range between $219.54 and $224.56, AMZN is basically asking the market a simple question: buy the dip or bail out?
The Technical Picture
What makes this interesting is the pattern. Arturo Robles noted this looks just like August's pullback, which turned into a monster rally. If history repeats and $220 holds, we could see Amazon push toward new all-time highs before year-end. But if sellers take control here, $212 becomes the next stop.
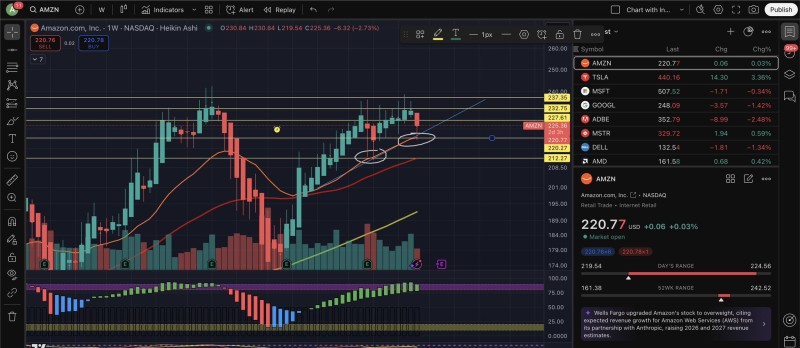
The weekly chart tells a clear story:
- Support: $220 (21-week EMA) is the line in the sand
- Resistance: $227.61, then $232.75, with the big prize at $237-$240
- Breakdown target: $212 if current support fails
- Higher low potential: Holding here confirms bullish structure
What's Driving Amazon Right Now
Amazon Web Services keeps crushing it, especially with AI deals like the Anthropic partnership that should boost 2026-2027 revenues. Wells Fargo just upgraded the stock to overweight, citing stronger cloud growth and better revenue forecasts. Even with tech volatility everywhere, large caps like Amazon are holding up as the "safe" growth plays.
The risks? A clean break below $220 opens the door to $212. Broader macro headwinds from Fed policy or weak consumer data could drag all tech names lower. And if AWS growth slows or retail demand softens, sentiment could shift fast.
 Usman Salis


