 Artem Voloskovets

⬤ AMZN just delivered a solid technical bounce right where it matters - at key Fibonacci support on the weekly chart. Price dropped to the 0.5 retracement level, formed a bullish engulfing candle, and climbed back above the 0.618 log Fibonacci zone. The weekly chart shows Amazon trading higher after pulling back sharply from resistance around $242.52.
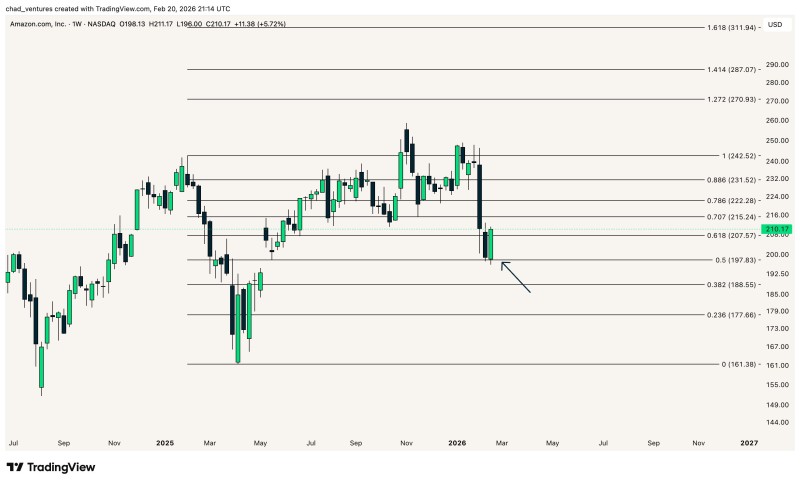
⬤ Looking at the Fibonacci setup on the chart, you can see levels mapped from AMZN's bigger upward swing - 0.382 sits around $188.55, 0.5 near $197.83, and 0.618 at roughly $207.57. After dipping toward that 0.5 support area, Amazon's weekly candle flipped with a bullish engulfing pattern, showing buyers stepping back in. "The reclaimed 0.618 level may signal renewed strength if it holds," noted the analyst. With price now trading near $210.17, this bounce above the crucial 0.618 retracement lines up with what traders typically watch for when looking for trend reversals or stabilization after deeper pullbacks.
⬤ Further up the chart, higher Fibonacci extension targets are visible - 1.272 near $270.93, 1.414 around $287.07, and 1.618 at about $311.94 - offering possible upside zones if momentum keeps building. Earlier analysis has covered how moves around Fibonacci pivots shape medium-term direction. For instance, AMZN Price Analysis: Break Above Key Zone Could Signal Mid-Cycle Rally discussed how reclaiming intermediate resistance can shift trend structure. Another piece, Amazon Stock Eyes Reversal After Major Pullback, highlighted how key support retests influence whether trends continue or deepen into bigger retracements.
⬤ What makes this development meaningful is how weekly Fibonacci retracements often line up with real structural turning points during corrections in longer trends. If Amazon holds price above the 0.618 level next week and confirms it's standing firm above this reclaimed area, the bullish engulfing candle might actually mark a solid bottom in the recent downswing. But if it can't hold this zone, the stock could slide further toward the 0.382 level and deeper support, shaping what happens next in the broader price action.
 Artem Voloskovets


