 Sergey Diakov

⬤ Apple (AAPL) remains locked in a strong upward trend on the weekly timeframe, backed by technical signals and systematic strategy alerts visible on the chart. The current long position opened in early April continues performing well, with AAPL now up more than 54% from that entry point around $177.
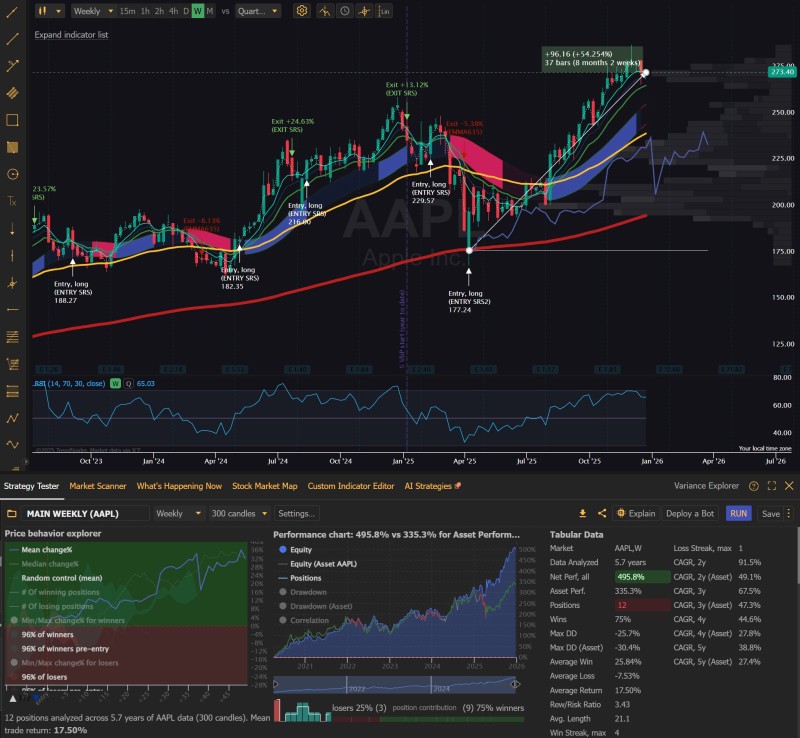
⬤ The chart shows multiple historical entries and exits over recent years, though the most recent Apple position stays open. After triggering near $177 in April, AAPL has pushed above $270. The stock trades comfortably above both its 50-week and 200-week moving averages, signaling persistent bullish momentum. RSI hovers near the mid-60s—strong without screaming overbought. Previous trades marked on the chart include winning exits and pullback periods, but this current signal hasn't closed yet.
⬤ Performance stats below the chart compare the system-based approach to raw AAPL returns over five-plus years. The strategy shows roughly 495% total performance versus approximately 335% for buy-and-hold Apple over the same stretch. Additional metrics cover win rate, maximum drawdown, average return per trade, and capital growth. The analysis notes that most human traders lack the emotional discipline to hold through such extended multi-month Apple runs—mechanical systems cut out psychological interference.
⬤ This matters because Apple ranks among the most influential stocks in major US equity indices. Ongoing AAPL strength often lifts overall market sentiment and reinforces large-cap tech leadership. The example also shows how disciplined, rules-based approaches can ride extended Apple trends without getting shaken out by short-term market chop.
 Sergey Diakov


