 Marina Lyubimova
⬤ Apple stock is drawing attention after a long-term chart showed how AAPL has repeatedly found support at its 200-week simple moving average over the past decade. The weekly log chart highlights several occasions since 2013 where the stock dropped toward this key technical level before bouncing back and continuing its upward climb. The most recent interaction happened in 2025, raising questions about whether this reliable pattern will hold once again.
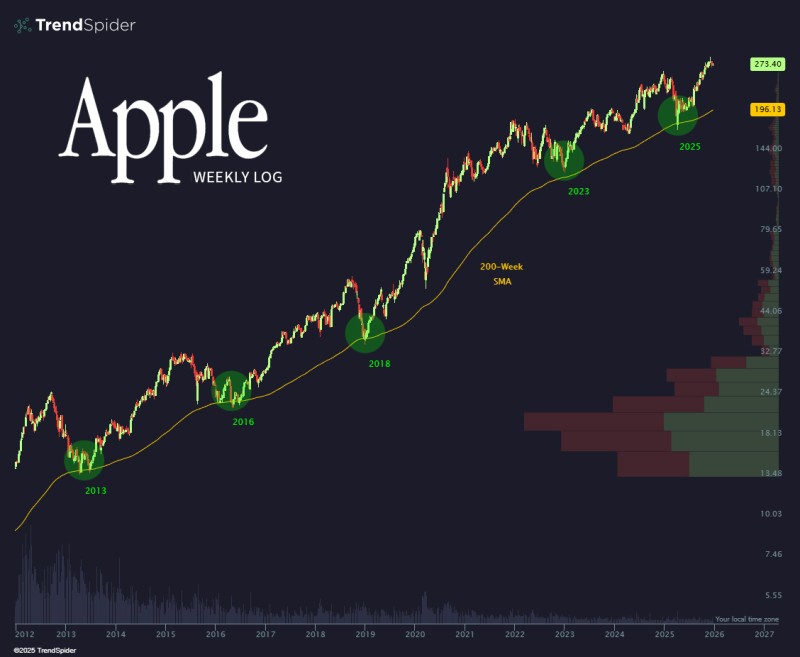
⬤ The chart pinpoints five major touchpoints with the 200-week SMA: 2013, 2016, 2018, 2023, and 2025. Each time, Apple either approached or briefly dipped near this long-term moving average before stabilizing and pushing higher. Right now, AAPL is trading above that line after its latest bounce. The volume profile on the chart shows heavier trading activity clustered around historically important price zones.
⬤ Despite several corrections along the way, Apple has kept its strong long-term uptrend intact throughout this period. The 200-week SMA is a go-to indicator for many traders because it smooths out short-term noise and helps identify whether a stock is still riding a bigger upward wave. For Apple, repeatedly finding support at this level shows it's been acting as a reliable long-term trend guide rather than just a short-term signal.
⬤ Despite several corrections along the way, Apple has kept its strong long-term uptrend intact throughout this period. The 200-week SMA is a go-to indicator for many traders because it smooths out short-term noise and helps identify whether a stock is still riding a bigger upward wave. For Apple, repeatedly finding support at this level shows it's been acting as a reliable long-term trend guide rather than just a short-term signal.
⬤ In other ai news, Apple has tightened App Store AI data-sharing rules in a major privacy shift, underscoring its focus on user privacy as artificial intelligence becomes more deeply integrated across its ecosystem.
 Marina Lyubimova


