 Saad Ullah

⬤ Apple shares have taken a sharp hit from recent all-time highs, dropping almost exactly 10% from the peak. The daily chart shows AAPL slicing through its 50-day moving average, a clear sign that short-term momentum has stalled. The focus has now shifted to the rising 100-day moving average, a level that's repeatedly acted as both support and resistance during previous trading phases.
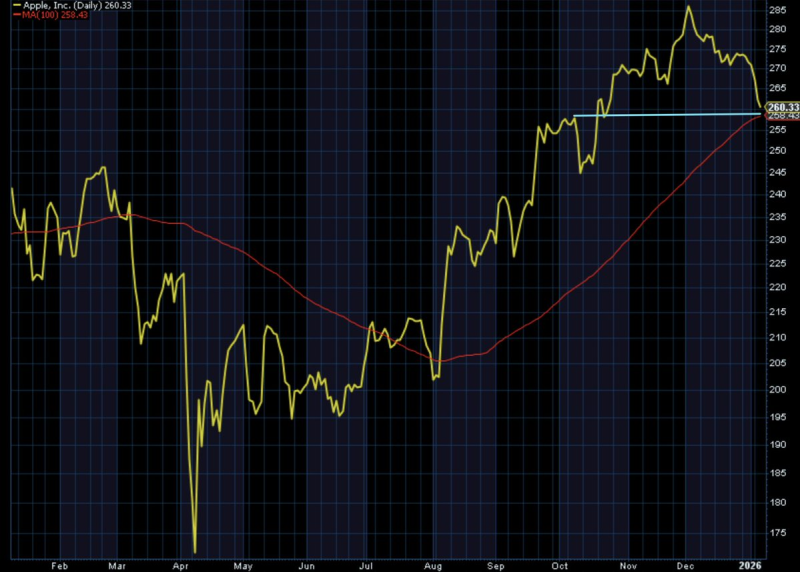
⬤ The stock is currently hovering near this upward-sloping 100-day average, sitting just below $260. This level has historically served as a critical inflection point for AAPL, often marking pauses or reversals within broader trends. After a strong rally into late 2025, the recent pullback looks more like cooling momentum than a break in the longer-term structure, with the stock consolidating around a well-defined technical zone.
⬤ Momentum indicators paint a vivid picture of the decline's intensity. Apple is trading near the lower Bollinger Band, while the 14-day RSI has dropped to around 27—firmly in oversold territory. These signals show how quickly selling pressure built up rather than suggesting prolonged weakness ahead. The drop has also coincided with valuation compression following the stock's extended run earlier in the cycle.
 Saad Ullah


