 Usman Salis

⬤ Apple Inc. (AAPL) is consolidating after a strong multi-month rally, with the stock currently trading around $271.01. A forecast model included in recent analysis suggests a swing-trading scenario where AAPL stabilizes before gradually climbing toward higher price levels. The chart displays a LEAF evaluation reading of +3.00, signaling a net-positive zone according to the platform's internal scoring system.
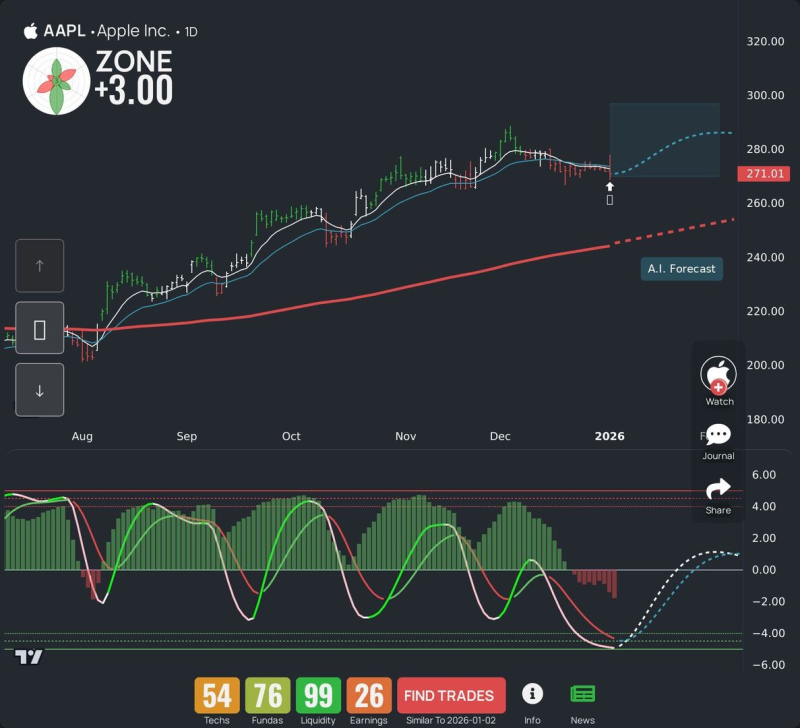
⬤ The daily chart reveals sideways movement through late November and December following an uptrend from August through October. A short-term moving-average crossover has weakened, though the longer-term red moving-average trend line continues sloping upward below current price, indicating sustained long-term support. The projection visualizes a potential bounce pattern with a dotted path extending from current levels toward the upper $270s to low $280s range, though no specific timeline is provided.

⬤ Momentum indicators show a recent downturn followed by a projected upturn illustrated through a dotted future curve. Histogram bars have contracted after stronger upside activity earlier in the quarter. Additional metrics reveal Techs at 54, Fundamentals at 76, Liquidity at 99, and Earnings at 26, offering a snapshot of aggregated factor ratings for the stock.
 Usman Salis


