Peter Smith

⬤ The U.S. Dollar Index DXY has been grinding through a narrowing range on the daily chart, hovering just below horizontal resistance at 97.80-98.00 and the 50-day EMA near 97.86. The index printed a doji candle right at ascending trendline support - a textbook sign of indecision. Buyers keep defending higher lows, sellers keep pushing back at resistance, and volatility keeps shrinking. As the 10-year rally pattern shows, this kind of compression in DXY rarely lasts long before a decisive move follows.
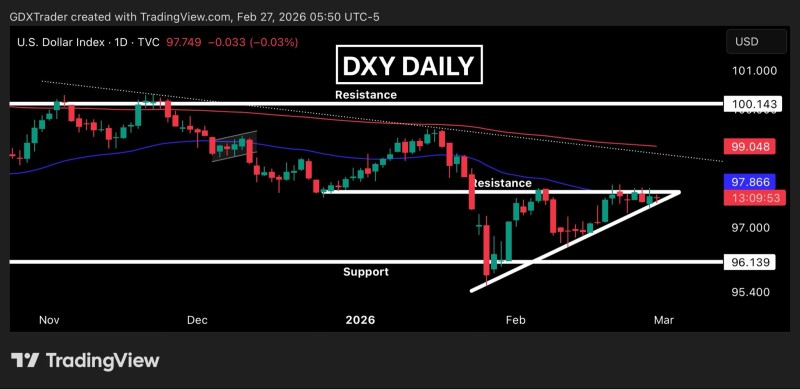
⬤ Zoom out on the daily structure and you can see DXY carving out a tightening triangle - descending resistance from prior highs pressing down, rising support from the February lows near 96.10 holding up. The 50-day EMA acts as a technical ceiling, while that horizontal zone keeps capping any upside attempts. A clean close above both levels could put the 200-day moving average in play, which lines up with a descending trendline from the 100.00 region.
⬤ This kind of consolidation is essentially a coiled spring. Volatility is contracting, the structure is tightening, and the market is building energy for a move. Until DXY either breaks above the resistance zone or cracks below the ascending trendline, it stays stuck in this tug-of-war. Bulls are defending trend support; bears are capping rallies near resistance. For traders tracking the 97.33-97.46 gap zone, that level remains a key reference on any pullback.
⬤ What happens next matters beyond just the dollar. DXY is a benchmark for global FX pairs and commodities, so a breakout above resistance could signal renewed dollar momentum and shift broader currency sentiment fast. Fail to hold rising support, and the 96.10 zone comes back into focus quickly. With technical levels this clearly defined, the setup is there - it is just a matter of timing. The long-term picture still holds up: DXY continues to rest on a 14-year uptrend support, which adds weight to the bull case if this compression resolves higher.
 Peter Smith