 Eseandre Mordi

⬤ The S&P 500 (SPX) just hit a significant milestone in market breadth: 12.5% of its stocks reached new 52-week highs—the highest percentage in over a year. When the S&P 500 has shown similar breadth strength in the past, the index usually kept climbing three weeks and one month later. This comes as the SPX hovers near record levels, with momentum spreading beyond just mega-cap tech stocks.
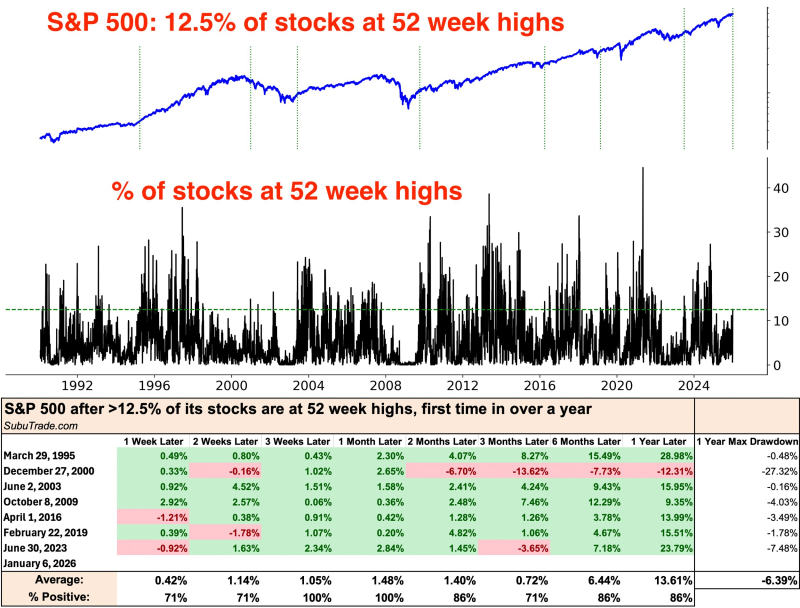
⬤ Historical data reveals a clear pattern. When more than 12.5% of S&P 500 stocks hit 52-week highs for the first time in over a year, the index typically moved higher in the following weeks and months. Past examples include a 2.30% gain one month later in March 1995, 1.58% in June 2003, and 2.48% in October 2009. More recently, June 2023 saw a 2.84% increase one month out and a massive 23.79% surge over the following year.
⬤ Looking at longer timeframes, the numbers get even more compelling. Across these historical periods, the average one-year return was 13.61%, with the S&P 500 finishing higher 86% of the time. While short-term pullbacks did happen—as shown by the maximum drawdown data—the broader trend stayed positive in most cases. There were exceptions, like December 2000, when the index eventually declined despite initial breadth expansion during the dot-com crash.
 Eseandre Mordi


