 Eseandre Mordi

⬤ The S&P 500 keeps pressing toward record levels - yet investors now owe their brokers more than at any time since 2021. In seven months margin debt has jumped about 42 %. This size of jump has occurred only five times before and in every case the index stood lower twelve months later.
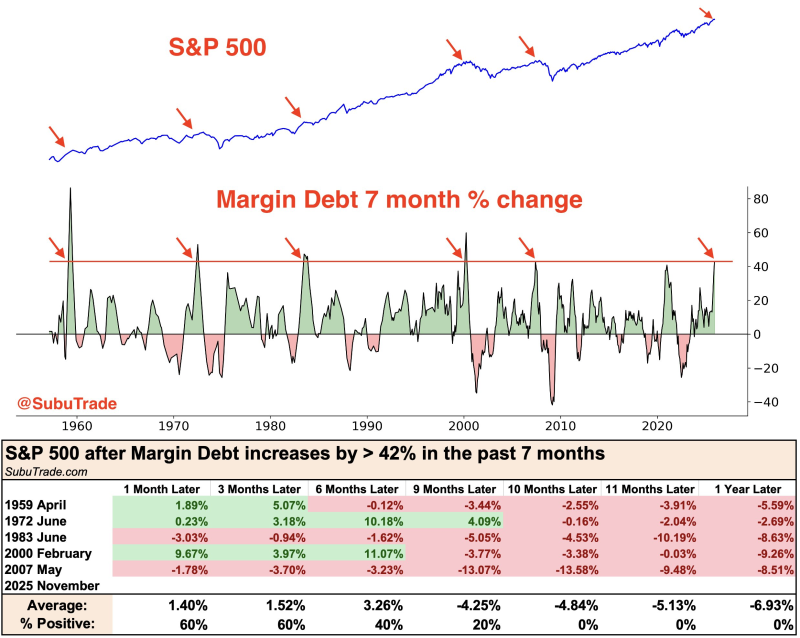
⬤ History shows that each surge ended long advances. The episodes began in April 1959, June 1972, June 1983, February 2000 and May 2007. In each period traders borrowed heavily while prices rose - in each, the advance soon reversed.
⬤ A clear rhythm appears in the data. During the first two months after such a jump, the market often stays firm. By the sixth month, the average return slips below zero. From the ninth month onward, the damage widens. After a full year, the index has always registered a loss. The two most recent examples - early 2000 and mid-2007 - led to severe bear markets.

⬤ This matters because margin debt reveals how much of the market's lift rests on borrowed cash. Heavy leverage speeds gains while confidence lasts - yet it also magnifies the drop once selling starts. With borrowing now at a level seen only five times in seventy years, the signal is not background chatter - it is a clear warning for 2025.
 Eseandre Mordi


