Saad Ullah

⬤ The S&P 500 is holding stubbornly close to its all-time high while chaos unfolds beneath the surface. According to The Kobeissi Letter, at least 115 companies in the index have dropped 7% or more in a single day over just eight trading sessions. Yet the index itself sits only about 2% off its peak—a striking disconnect.
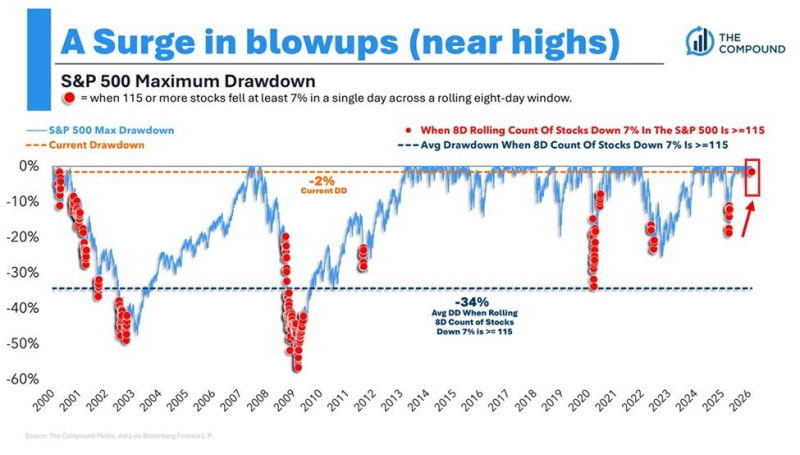
⬤ History suggests this kind of internal damage usually shows up during much steeper selloffs. When 115 or more stocks fell 7% within an eight-day stretch in the past, the S&P 500 was down an average of 34%. That makes today's shallow 2% pullback look almost surreal. Similar cracks appeared in S&P 500 breadth drops to 51% lowest in five months, where weakness spread quietly under a calm index surface.
⬤ What sets this moment apart is timing. The benchmark is sitting near highs while individual names get hammered. The last time something like this happened was during the 2000 dot-com bubble, when the index kept climbing even as tech stocks imploded. In 2008, by contrast, widespread stock crashes came after the market had already rolled over.
As The Kobeissi Letter noted, the divergence indicates a market structure where index performance and underlying breadth are not moving together.
⬤ More context on internal deterioration appears in S&P 500 enters bearish breadth regime, which flags weakening strength across key measures. The gap between the index and its parts points to a market propped up by a handful of heavyweights. When dozens of stocks are bleeding while the benchmark barely flinches, it's a sign that leadership is dangerously narrow. That kind of imbalance rarely lasts.
 Saad Ullah