 Usman Salis
⬤ The S&P 500 is showing a major improvement in market breadth, signaling healthier conditions across the index. For the first time in more than 200 days, fewer than 50% of S&P 500 stocks are stuck in correction. The timing is notable—the SPX is trading near record highs as this breadth recovery takes hold.
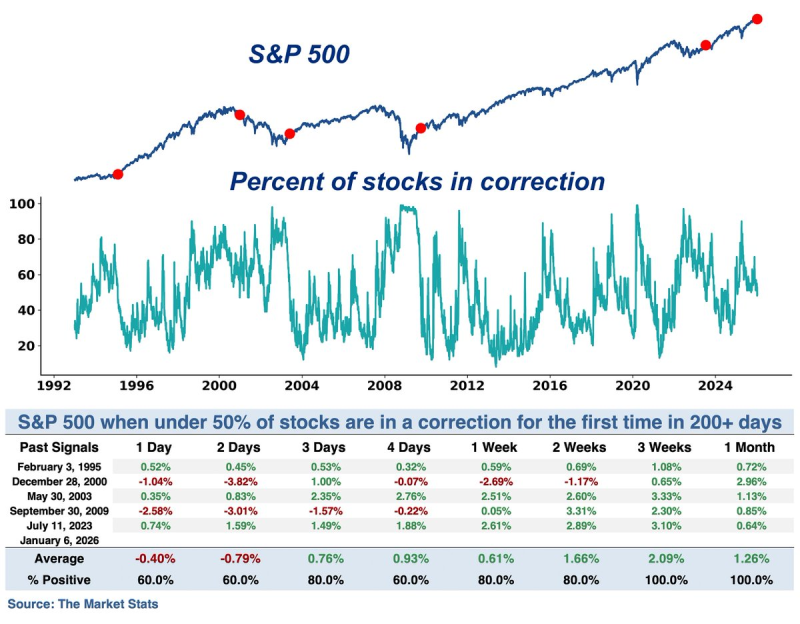
⬤ Looking at data stretching back to the early 1990s, these breadth improvements have historically marked turning points. When the share of stocks in correction drops below 50% after extended weakness, it typically signals that market gains are spreading beyond a handful of big names. The chart shows repeated cycles of contraction and recovery, with these sub-50% readings often appearing right before the index gathers strength.
⬤ The historical performance data is striking. In every previous case when this breadth signal triggered after a 200+ day absence, the S&P 500 posted positive returns three to four weeks later—a 100% success rate. Average performance turned positive across one-week, two-week, and one-month timeframes. The latest signal flashed in early January 2026, fitting right into this historical pattern.
⬤ Why this matters: broader participation means the market's strength isn't riding on just a few heavyweight stocks anymore. When corrections ease across the index, the rally becomes more sustainable and evenly distributed. With the SPX hovering near elevated levels, tracking breadth trends will be crucial for determining whether recent gains have solid support underneath them.
 Usman Salis


